Candlestick charts format naming and meaning in candle charts
Post on: 16 Март, 2015 No Comment

Technical Analysis Candlestick charts
Candlestick charts are my preferred chart type because I can use candle chart patterns as part of the buying and selling process to find short term price turning points and additionally these patterns are used for support and resistance.
Special offer: Capturing Profit with technical Analysis
If you are new to candlestick charts it will not be that easy learning and recognizing all the patterns. I would like to suggest that you read through the chapter and that you start by recognizing at least the following patterns.
Bottom reversal: Hammer, Engulfing bullish, Bullish harami (cross), Piercing line and Morning star patterns.
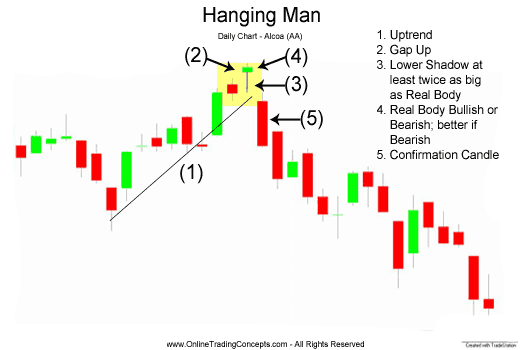
Top reversal: Hanging man, Engulfing bearish, Bearish harami (cross), Dark cloud cover and Evening star patterns.
Introduction
In the 1700s, a legendary Japanese rice trader named Homma used trading techniques that eventually evolved into the candlestick techniques that technical analysts on the Japanese stock market used in the 1870s. Steve Nison introduced these techniques to the Western world in his first book, Japanese Candlestick Charting Techniques.
The advantage of using candles on charts is that single or multiple candle patterns give earlier and more reliable reversal signals. Every candle shows the activity for the referenced period in hourly, daily, or weekly charts, for example.
Figure 6.1: Horizontal reference points of the candlestick.
Search the Internet
In figure 6.1, the horizontal reference points of the candle represent the opening price, the highest price, the lowest price, and the closing price of the considered period. The rectangular portion of the candle, or the body, represents the range between the opening and the closing prices. If the closing price is higher than the opening price, the body is white (not filled). If the closing price is lower than the opening price, the body is black (filled).
A candle consists of either just a body or a body with an upper and/or a lower shadow. A candle with an opening and closing price at almost the same price level is called a doji (figure 6.2). The candlewicks are called shadows, and they extend up to the highest price and down to the lowest price of the related period. Candlestick charts can be used in any time frame, including minutes, hours, days, weeks, or months.
Candlestick chart patterns are formed by one or more candles; they indicate a short-term trend reversal or a trend continuation. You must always take into account the previous trend when interpreting candlestick patterns.
Candlestick patterns do NOT give price targets!
Figure 6.2: Candlestick naming.


