Candlestick Charting A Peek Into Market Psychology
Post on: 16 Март, 2015 No Comment

Candlestick charting was developed by Japanese rice traders over four centuries ago and could quite possibly be the oldest form of technical analysis. Since technical analysis is not only predicting probable price moves but also assessing market psychology, candlestick charting is probably the best tool to give the trader these answers in the shortest amount of time. Once a trader becomes familiar with candlestick charting, he or she can get a quick and highly visual signal because of the story candlesticks tell. Strict adherers to candlestick methodology take positions based on very short term patterns given by candlestick tradition. While candlestick charting is relatively unknown, and therefore unpracticed by the common investor, their use among active traders is growing. The greatest benefit candlestick charts provide the technical analyst is the ease of use and interpretation. The same price action, quickly seen using candlestick charts, may go unnoticed while scrolling through bar charts.
While analysis of chart patterns takes experience and some practice, so too will candlesticks. However, after learning the basic signals, candlesticks can provide the novice trader a shorter learning curve and also shorten the learning curve to chart reading in general. I like using bar charts to find chart patterns, and then switch to candlesticks for a closer look. Candlestick charts are especially useful when analyzing areas of consolidation such as triangles and flags for signs of reversal or continuation.
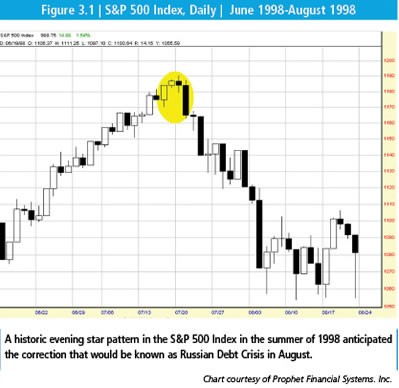
The major signals in candlestick theory are reversal signals. Some of these signals are considered so strong by serious candlestick practitioners they will enter a trade based on its signal alone, without the need for conformation. Since I rarely see the price of a stock turn on a dime, I usually keep an eye on the stock and enter a trade when the price retests support or resistance.
While I’ve incorporated candlestick charting into my trading strategies for quite some time, I have learned that there are a few technical criteria that will enhance the candlestick reversal signal. Some of these criteria include:
Heavy volume on the reversal day — I look for volume to be greater than one and a half times normal volume.
Greater than average price movement on the reversal day — I look for the price to exceed its normal daily price range and appear longer on the chart than most daily candles.

Stock price that is heavily overbought or oversold — I look for the price to accelerate away, but in the same direction as the current trend.
Signal forms on technical support — I look for the reversal signal to reveal itself on a trend line, moving average or horizontal support.
While candlestick charting is enjoying a following that has grown in recent years, it should be viewed as just another tool the trader uses to profit in the market, not as a foolproof method of entering or exiting a stock. The signals tell a story of the psychology of the market. Sometimes the signals are only valid for a short period of time, but at key levels of support and resistance the reversal signals given by candlestick patterns can tip the trader off to a healthy price move.
My suggestion to any active trader is to take some time and learn the major candlestick reversal signals. There are many good books and courses available on the internet that are reasonably priced and will allow the trader to learn at his or her own pace.


