Calculating the New VIX—the Easy Part CBOE Options Hub
Post on: 27 Май, 2015 No Comment

The movements of the CBOE’s VIX® are often confusing. It usually moves the opposite direction of the S&P 500 but not always. On Fridays the VIX tends to sag and on Mondays it often climbs because S&P 500 (SPX) option traders are adjusting prices to mitigate value distortions caused by the weekend .
In addition to these market driven eccentricities the actual calculation of the VIX has some quirks too. The VIX is calculated using SPX options that have a “use by” date. Every week a series of SPX options expire. This schedule of expirations forces a weekly shift in the VIX calculation to longer dated options. For many years the CBOEs VIX calculations only used monthly SPX options, but starting October 6 th. 2014 it switched to using SPX weekly options when appropriate. See Why the Switch section towards the bottom of this post for more information.
The VIX provides a 30 day expectation of volatility, but the volatility estimate from SPX options changes in duration every day. For example, on October 13, 2014 the SPX options expiring on the 7 th of November provide a 25 day estimate of volatility, while the November 14 th options provide a 32 day estimate. In this case to get a 30 day expectation the VIX calculation uses a weighted average of the volatility estimates from these two sets of November options.
The newly updated S&P 500 VIX calculation is documented in this white paper . It computes a composite volatility of each series of SPX options by combining the prices of a large number of puts and calls. The CBOE updates these intermediate calculations using the ticker VIN for the nearer month of SPX options and VIF for the further away options. The N in VIN stands for Near and the F in VIF stands for Far. These indexes are available online under the following tickers:
- Yahoo Finance as ^VIN, ^VIF
- Schwab $VIN, $VIF; historical data available
- Google Finance INDEXCBOE:VIN, INDEXCBOE:VIN; historical data available
- Fidelity: .VIN. VIF; limited historical data
The final VIX value is determined using the VIN and VIF values in a 30 day weighted average calculation. Graphically this calculation looks like the chart below most of the time:

As shown above the VIX value for October 13 th is determined by averaging between the November 7 th SPX options (VIN) and the November 14 th SPX options (VIF) to give the projected 30 day value. If you look closely you can see that the interpolation algorithm used between VIN and VIF does not give a straight line result; I provide calculation details later in The Weighted Average Calculation section.
The chart below shows the special case when the VIX is very close, or identical to the VIF value.
Wednesdays are important days for the VIX calculation:
- The VIX calculation is dominated by the VIF values.
- The SPX options used switch such that the old VIF becomes VIN and the options with 36 days to expiration become VIF.
- Once a month on a Wednesday VIX futures and options expire (expiration calendar ). Soon after market open a special opening quotation of VIX called SOQ is generated. Its ticker is VRO and its used as the settlement value for the futures and options. Unlike the VIXs normal calculation, the SOQ uses actual trade values of the underlying SPX options not the mid-price between the bid and ask. Only one series of options, the ones with exactly 30 days to expiration are used.
Although SPX weekly options are available for 5 weeks in the future, the VIX calculation uses the SPX monthly options (expiring the 3rd Friday of the month) instead of the weeklies when they fit into the 24 to 36 day window used by the calculation. The SPX weeklies expire at market close on Friday but the monthly options expire at market open on Friday. By using these monthly options the CBOE keeps the VIX futures / options settlement process identical with the previous month based VIX calculation.
Why the Switch?
The chart below illustrates how the CBOE changed the VIX calculation methodology.
This particular snapshot shows the old VIX calculation (ticker: VIXMO) doing an extrapolation using SPX monthly options expiring November 22 nd and December 20 th (11 and 39 days away from the 30 day target)—a hefty distance. If you would like more details about the old VIX calculation see Computing the VIXMO —the easy part . The new VIX calculation on the other hand always does an interpolation over a much shorter period of time—never using options with expirations more than +-7 days from the 30 day target. This CBOE article gives a good overview of the advantages of the new approach.
If you look closely at the chart, you can see that in this case the VIX calculation using the two methods arrives at slightly different answers (black line). The new method gives a result of 21.16, 1.5% higher than the old methods 20.85. While Im confident that the new calculation will be better in the long run because of the tighter VIN / VIF brackets I do have some concerns about the current volumes and low open interest in the SPX weekly options that are 4 to 5 weeks out. I have seen the VIX / VIXMO differ by up to 5%—so for the time being Im keeping both indexes on my watch lists.
The Weighted Average Calculation
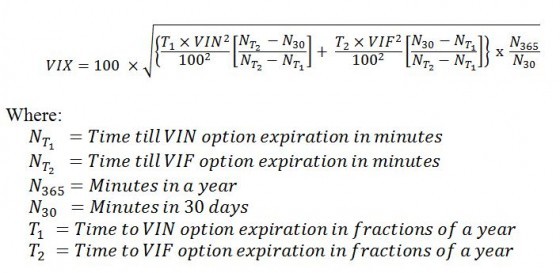
If you want to compute the VIX yourself using the VIN and VIF values you cant just do a linear interpolation / extrapolation because volatility does not vary linearly with time. Instead you have to convert the volatility into variance, which does scale linearly with time, do the averaging, and then convert back to volatility. The equation below accomplishes this process.


