Best Trend Trading Setups With Examples
Post on: 17 Апрель, 2015 No Comment

Continuation Setups
A continuation trade setup is based on finding an entry point in an existing trend. Trends are where traders are likely to make the most money, so having a few continuation setups in your strategy arsenal is crucial.
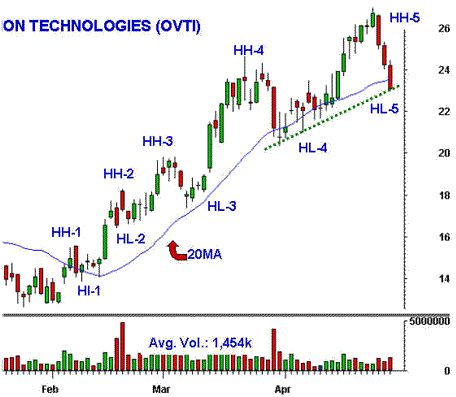
Perhaps the most important thing to remember with this setup is that prices never move in a straight line, at least not for long. Instead, a stock uptrend moves in waves – one step higher, half a step back, and so on. Downtrends are no different. The price drops, followed by a rebound and then another drop. Continuation setups attempt to exploit this movement by entering during the pullback stage, and then riding the next wave of the trend to a profit.
Figure 1 shows how a trend may develop. General Electric (GE) is moving higher overall, as the price is making new highs and higher lows. Notice the zigzag pattern – a strong price move higher, followed by a less strong pullback. By entering on the pullback you’re positioned for the next wave higher, but you still need to find an entry point. Please note that all example charts are created using FreeStockCharts.com:
There are a number of tools and indicators you can use to enter a trade when a stock provides a continuation setup.
See Also: Ten Commandments of Futures Trading
After a pullback, in order for the uptrend to continue the price must begin to move higher again. Trendlines can often be drawn around the correction, identifying its course; when the price breaks above the trendline it signals the correction is likely over, and the trend is resuming.
In Figure 2, simple trendlines have been added, connecting the high points in several pullbacks. The trendlines provide a frame of reference for the direction of the stock. When the price breaks above one of these trendlines it indicates that the trend may be continuing.
There are always multiple pullbacks, of varying degrees of intensity, during a trend. Active traders may wish to participate in many of them, while longer-term traders may only wish to participate on longer-term opportunities, such as the buy signaled in late November. For this particular entry method, a target is usually placed just beyond the previous high point, and a stop loss is placed below the recent low.
As the price moves higher, the stop can be moved up to just below new price lows that form, locking in a potential profit.
The main problem with this strategy is that the trendline may need to be drawn multiple times before a breakout occurs. In hindsight it is easy to draw a line connecting the high points of the pullback, but in real-time is can be a challenge and takes practice. The upside is that the reward significantly outweighs risk if the trend continues. Therefore, even if a couple losing trades occur before a winner, the strategy can still be profitable.
Indicators can be used to help verify price patterns, such as those discussed prior, or can be used on their own. During a trend, an indicator provides clues as to when a pullback is ending, and the trend is resuming.
The RSI is a commonly used indicator, but when a moving average is applied to it, not only can it help confirm trade signals from other strategies, it can also generate its own buy and sell signals.
In Figure 4, a 14-day RSI is shown, along with a moving average (15) of that RSI. When the RSI crosses above the moving average it indicates a buy signal. The buy signals are most powerful in a trending market, as the signal indicates the uptrend is continuing. When the RSI crosses back below the moving average the long trade is exited. These points are marked with arrows and corresponding vertical lines on the chart. When a signal occurs to exit a position, it is also signaling a potential reversal is underway.
Using an indicator can help confirm these types of continuation trades, and signal when a pullback is likely to continue instead of a breakout. Continuation price patterns can also be applied during a downtrend, to indicate when it is continuing.
This strategy is quite simple, and during a trending market can be very profitable as well. Yet if the price becomes choppy the RSI may also get choppy, producing signals that get traders into or out of positions too early. The RSI-moving-average strategy also does not have a specific stop loss, which can lead to large losses if the price changes direction quickly. This can be remedied by incorporating a similar stop loss strategy as discussed in the price pattern section above. After a buy signal, place a stop below the recent low to limit losses.
Indicator Patterns
If trading with the trend is profitable, it is also necessary to be able to spot when a trend is potentially ending, and a new one beginning. Reversal setups are based on price patterns or indicators that signal an uptrend (or downtrend) is over or nearing completion, and the trend is likely to change direction.


