An Intro to Moving Averages Popular Technical Indicators
Post on: 15 Август, 2015 No Comment

by Wayne A. Thorp, CFA
Over the last few articles, we have covered many of the basics of technical analysis, mainly chart types and pattern recognition. Having laid the foundation, it is time to move on to a more involved discussion and delve into the core of technical analysisindicatorsand how they are used in the analysis process and in the development of systematic trading strategies. To get things started, we will begin with one of the more basic, yet quite popular, indicatorsmoving averages.
Moving averages
Moving averages are among the oldest and most widely used technical analysis tools. Due to the relative ease with which they are calculated, moving averages are the preferred tools of newcomers to technical analysis. They have also found favor among some fundamental analysts who make decisions on fundamental factors such as earnings and sales but use moving averages to time buy and sell decisions. With the wide availability of computers and their increased use in financial analysis, you can now create moving averages covering several decades worth of data in a matter of seconds.
A moving average is defined as the average price of a security over a set time period. In essence, moving averages are bending trendlines. Remember that a trendline is typically drawn between two or more peaks highs or troughs lows in the price movement of a security. Over time, both trendlines and moving averages can be used to establish points of resistance or support for the price. However, moving averages overcome some of the criticisms of trendlinesmainly that they are subjective in their construction. While moving averages can be customized to meet individual needs, they are still based on cold, hard mathematical calculations. In addition, whereas straight-line trendlines are static in nature, moving averages portray dynamic levels of support or resistance as prices move.
Moving averages, by their very nature, smooth data. In other words, they tend to eliminateor at least lesson the impact ofblips or outliers in price data. Moving averages show trends in price, but their nature is to represent the trend in a smoothed fashion.
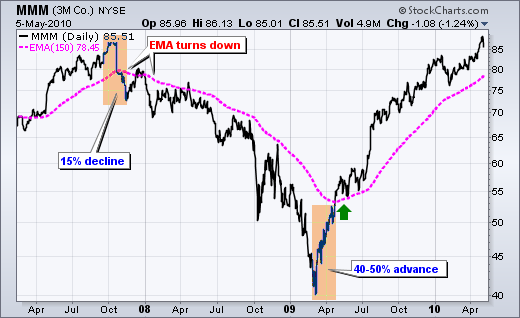
When looking at either one or several moving averages plotted on a price chart, the interpretation is generally the same. As long as the current market price is above the moving average, an uptrend is in progress. On the other hand, if the current market price is below the moving average, a downtrend is occurring. When a securitys price violates a moving average from either the upside or downside, we can interpret this as a warning flag that the current trend may be coming to an end. If the reversal lasts long enough to change the direction of the moving average, this is usually considered an indication that the trend has ended.
In calculating a moving average, there are several factors you need to take into account, the most important of which are: the time period over which the average is calculated, the price input used in the calculation, and the type of average you wish to use.
Time period
The element that has the greatest impact on a moving average is its time span. In deciding upon the time period, you will need to examine your investment needs and interests, as well as your investment horizon. A staple among analysts for identifying long-term trends is the 200-day moving average. Shorter time periods can also be used, such as
10-, 20-, 50-, and 100-day moving averages.
If you trade on a more short-term basis, or trade in markets such as futures, 10- or 20-day moving averages would probably better suit your needs. Investors whose positions last for a longer period of time tend to use 100- or 200-day moving averages. Be aware, though, that these are just general guidelines and that each person has his own unique trading preferences. You may wish to test several different time periods until you find one that best matches your trading strategy.


