ADX Average Directional Movement Technical Analysis Indicator
Post on: 22 Июнь, 2015 No Comment

ADX Indicator
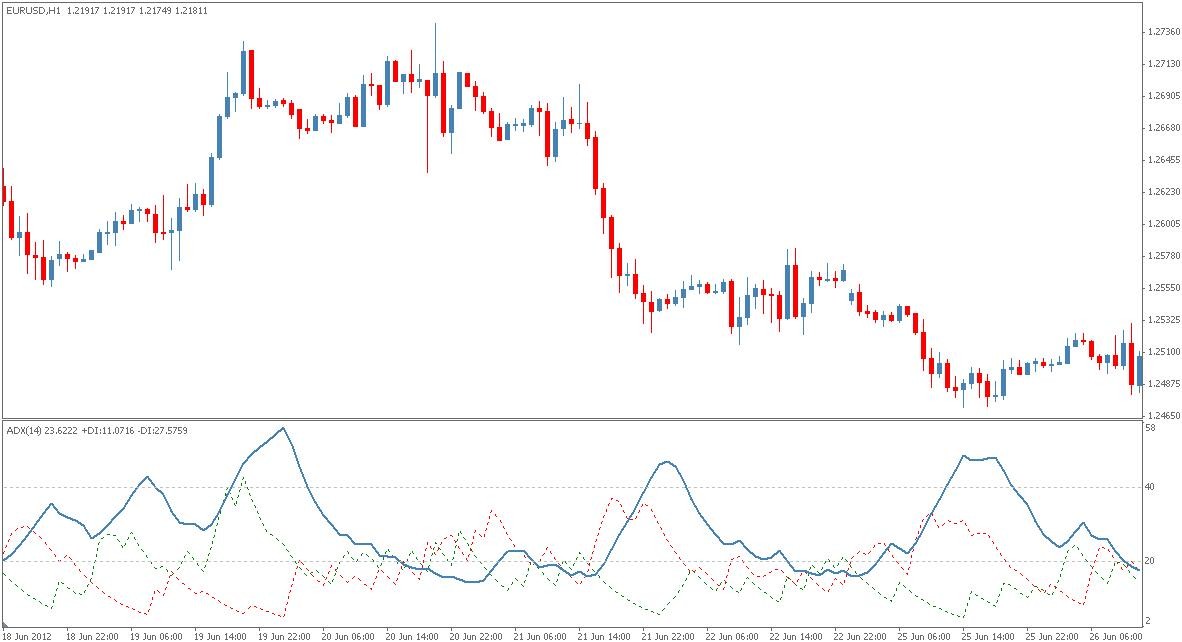
The Average Directional Movement Index (ADX) technical analysis indicator describes when a market is trending or not trending. When combined with the DMI+ plus and DMI- minus (see: DMI ) the ADX can generate buy and sell signals.
However, the main purpose of the ADX is to determine whether a stock, future, or currency pair is trending or is in a trading range. Determining which mode a market is in is helpful because it can guide a trader to which other technical analysis indicators to use.
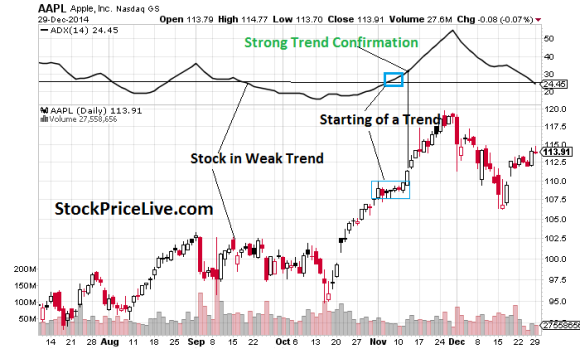
The chart of the E-mini Russell 2000 Index Futures contract below shows an excellent example of the ADX in action:
ADX Shows Trend Strength
The first concept to remember is that the direction that the ADX moves doesn’t depend upon the direction of the underlying stock. All the ADX shows is the trend strength.
As can be referenced from the chart of the E-mini Russell 2000 Index Futures contract above, when the e-mini future was rising in a strong upward trend, the ADX indicator was rising.
When the e-mini futures contract moved into a non-directional consolidation phase, the ADX decreased.
ADX is a Great Complement to Other Technical Indicators

The ADX is so popular because determining whether a stock, commodity, or currency market is trending or not trending can help a trader avoid the pitfalls of some indicators.
Moving Averages
Moving averages and their variants are effective during trending markets ; however, during consolidation periods when prices go up and down, but in no direction, moving average indicators have a tendency to give numerous false buy and sell signals that add up to trading losses. During trending markets, use moving averages. trendlines, and other trend following technical indicators.
Oscillators
Oscillators are extremely effective in non-trending markets. Buying low and selling high is accomplished quite readily with oscillators. Unfortunately, during trending markets, oscillators perform quite poorly, often selling short during a bull market run or buying during a bear market downtrend, adding up to large losses. For periods of non-trending, use oscillators like Stochastic Fast & Slow. RSI. or Williams %R and other range-bound indicators like Bollinger Bands or Moving Average Envelopes .
The importance of the 20-level and 40-level, along with more examples of the ADX in action, is covered on the next page.


