5 Contrarian Warning Signs That The Stock Market Is Too High SPY
Post on: 16 Март, 2015 No Comment

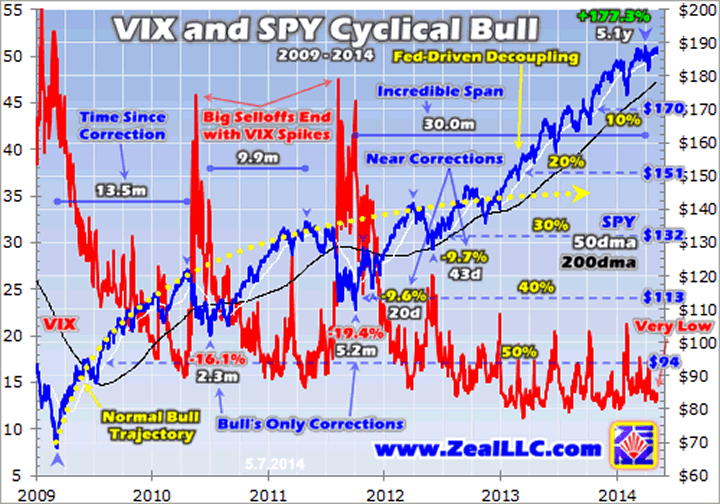
The stock market has been very agitating for the bears as the SPDR S&P 500 (SPY ) vaulted a remarkable 16% this year and 25% in the past 12 months.
Like a broken clock that’s right twice a day, the bears will eventually stand atop the podium. Here are five warnings signs the bears believe the stock market is excessively overvalued and that investors need to watch out for a correction.
1. Valuations are too high compared to the historic average.
The 10-year trailing price-to-earnings ratio on the S&P 500 is 24.2 as of Tuesday vs. an average of 16.5, based on market data going back to 1900, according to TrimTabs Investment Research. The S&P trades at 16 times forward earnings but that’s because analysts’ estimates are too positive, said David Santschi, CEO of TrimTabs. The Federal Reserve’s quantitative easing, or money printing program, has been the main driver this year, he said.
2. The S&P’s dividend yield is too low.
The higher prices go, the lower the yield. The S&P 500 currently shows a dividend yield of 1.94% vs. an average of 4.5% since 1900, according to Santschi. The yield is flirting with its record low of 1.1% last seen in August 2000 near the height of the tech bubble.
3. The market is too big relative to the economy.
The current value of the U.S. stock market totals $18.79 trillion while the U.S. gross domestic product (total of all goods and services) weighs in at $16.07 trillion. The stock market’s value currently amounts to 117% of GDP, according to the June Lamensdorf Market Timing Report. Readings above 72% are considered overvalued and 87% is considered bubble territory.

The ratio edges close to its pre-financial crisis, 2007 high of about 130%. At the height of the tech bubble, the stock market-to-GDP ratio was a record 169%. At the trough of the market in 2009, the ratio was considered undervalued at 60%.
Simultaneously, the national savings rate as a percentage of GDP is at a multi-decade low, the report stated. People continue to be stretched as their savings rate is insufficient to weather an economic downturn. There are inadequate reserves left to fuel any further expansion.
4. Contrarian sentiment indicators show the crowd is overly bullish while corporate insiders are very bearish.
The NYSE Bullish Percent indicator, a primary risk indicator, currently shows a reading in the mid-70s, suggesting an extremely fully valued market. Any number over 70 has a low risk-to-reward ratio of positive returns, the Lamensdorf report stated.


