1930 Stock Chart Analysis
Post on: 16 Март, 2015 No Comment

Looking for a 1930 stock chart of the U.S. Great Depression era from the early 1900’s?
You can find a couple of charts below and see how prices reacted during that time period beginning in the late 1920’s and extending through to the 1950’s.
This was the first page I added to my site on this topic and it covers more than just the 1930 time period. I’ve since done a better job with organizing charts and pages together.
In addition to the charts below, I have several other pages with charts and details showing comparisons between today’s stock market and the 1930’s Great Depression era. See the bottom of this page for links to several related pages on this site.
I will also be adding new related pages in the future so be sure to check back or subscribe to my email updates or free Newsletter for updates as they occur.
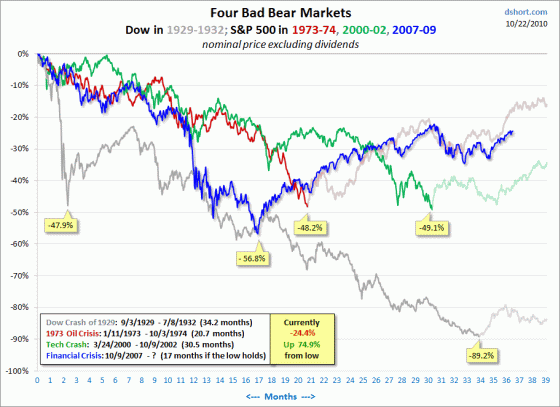
The first chart shown below is of the DJIA from late 1928 through early 1933 using weekly closing prices. The market top during this period was reached in August of 1929 at a level of 380. The bottom was reached 34 months later at a level of 44. This was a decline in stock prices of just under 90% from the top to the bottom.
You will notice that during this decline, there were several periods of rising prices, or bear market rally’s as we call them. These rally’s were short lived, although some lasted several months. In the end the trend was indeed down.
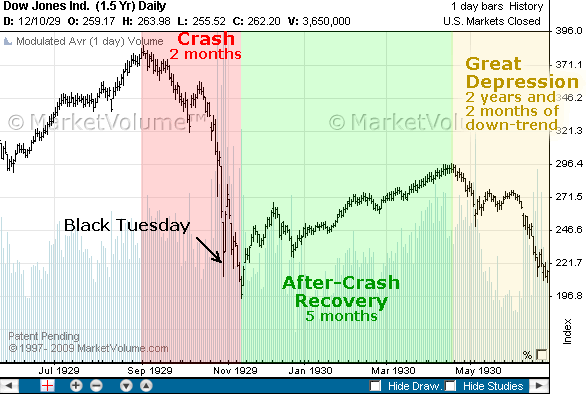
The next chart is a 1930 stock chart only, and shows the Dow Jones starting the year around 245 and finishing near 165. Although this is the year many people associate with the great depression (for this particular time period), this was in fact only one of many years that it would last.
The next 1930 stock chart from the US Depression era goes from late 1928 and this time goes up until January of 1955. The reason why I am showing a chart up to this time period, is that this is when the Dow Jones finally reached the previous top price level of 380 set in August of 1929.

Yes, you read that right. As you can see below, the Dow Jones didn’t reach the prior high set in 1929 until November of 1954, 25 years later. How would you have liked to have been a buy and hold investor during this time period, who started investing in the early 1920’s?
And finally I wanted to show a stock chart from this time period that shows what happened at the bottom of this cycle. You can see on the chart below that when the market finally bottomed in July of 1932, the market then went higher by almost 100% in the following 2 months. That’s right, it almost doubled in a two month time period off of the bottom.
If you enjoyed this post and/or found it to be useful, subscribe to Online Stock Trading Guide Updates at the top of the right column on any page of this site.


