What is Elliott Wave Does It Apply to Forex
Post on: 14 Октябрь, 2015 No Comment

Learn The Forecasting Power of Elliott Wave
You can opt-out at any time.
Elliott Wave has reached mythical status in many trading circles. This article will give you a breakdown of the broad concept as to how Elliott Wave can help you view market moves on charts also known as Technical Analysis in the Forex Market. The next few articles will also help you see how you can apply this disciplined approach to the FX market so that you can trade in the direction of the present trend while managing your risk well.
The Roots of Elliott’s Wave Theory
Ralph Nelson Elliott developed his theory that price action in any market unfolded in a wave-like formation. This observation by Elliott was cemented by looking at the Dow Jones Industrial Average when he was on bed rest for Malaria. Throughout his observations, he recognized 13 different patterns that seemed to play out over and over again not only in market indices like the Dow Jones Industrials and individual stocks like General Electric.
After compiling research through 75 years of market data, Elliott went on to write, Nature’s Law — The Secret of the Universe, which Elliott published in 1946 stating that not only were markets bound by these common movements or waves but so were all collective human behavior.
What Are Waves?
You can think of waves as movements in price. The common ways in which price moves was characterized into the Wave Principle by R.N. Elliott. Each price action wave that you see should be labled so that you can see how the waves are reactng with eachother and ideally, build a low risk trading idea around a wave formation.
A unique aspect of Elliott Wave Theory is that everything is a wave and therefore, even the price action that you might right of as random or of no consequence may purposely connect to major moves. This continuity means that the end of one wave is the beginning of a new wave and as you learn the characteristics of price action waves, you will be able to anticipate probable future price action.
The Basic Pattern
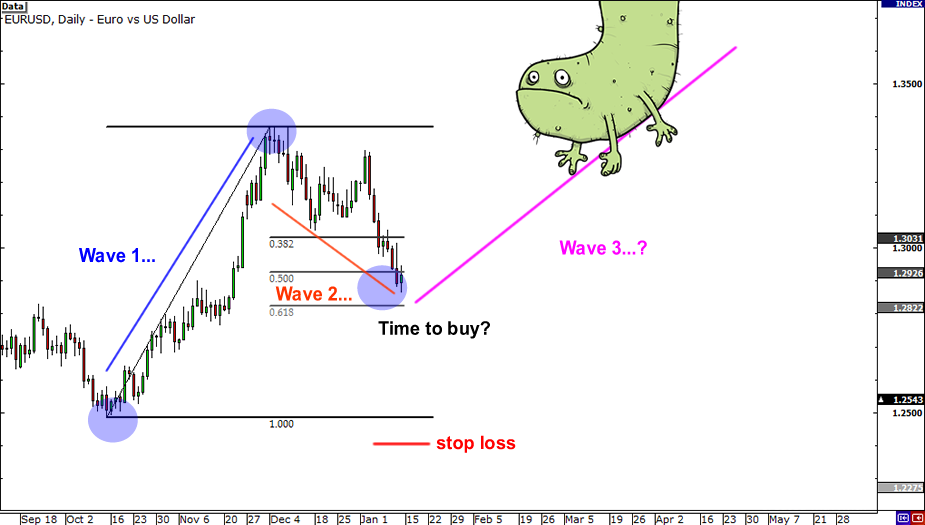
While you may call one large trend one move, Elliott Wave Theory would call a with-trend move an impulse. The basic pattern, which can happen in uptrends or downtrends, is a 5-individual moves or waves that are followed by 3-individual waves that are called correction waves or interruptions of the overall trend.
Wave 1: First move in a trend and often seen as a bounce from the prior trend
Wave 2: The first counter-trend move or correction of a new trend and often retraces a majority of the first move
Wave 3: This wave is usually the strongest and is when the news starts to catch up with the price improvements
Wave 4: This is the round of profit taking from many professionals and when many retail traders get into the trend excited that this is the, next Apple

Wave 5: The last move before a larger correction is in order, this wave can take a couple of shapes but it is usually much less dynamic than wave three and similar in length to wave 1.
Wave A: The first correction move but optimism still abounds that the trend will continue.
Wave B: Known as a correction of a correction and is often a suckers rally because it draws in people late to the party at a bad price.
Wave C: The last aggressive counter trend move before a new trend begins. This wave often pulls people in who believe a new trend is beginning but this is often the last move and not to be followed without tight risk limits.
Another unique factor of Elliott Wave is that if you are watching a daily chart where 5-waves are clear, you’ll also be able to clearly see 5-waves on a much smaller chart. This is known as a fractal, whereas the larger degree has a smaller degree of the same shape albeit a smaller size. This means that whether you prefer to trade off weekly or daily charts or hourly charts, Elliott Wave can help you manage your risk and identify opportunities.
This dynamic way of looking at the market takes on a new appreciation when you see how the market really has a propensity to play out in this manner. As someone who works alongside some of the top banks and trading desks in the market, I can attest that Elliott Wave is used as a way to recognize great opportunities on the charts while limiting risk as best as possible.
Next, we’ll look at the preferred tool to measure the extent to which price should move in certain waves.
Happy Trading & Stay Nimble


