What Is Bollinger Bands Squeeze and How to Trade It
Post on: 16 Март, 2015 No Comment

Bollinger Bands ® is a great indicator. There are thousands of traders around the world who use and trust this indicator religiously. We already have some good articles about this indicator and its upper, lower and middle bands. If you have not already seen those articles, please spend some time and read them carefully and then come back here to learn about the Bollinger Band Squeeze:
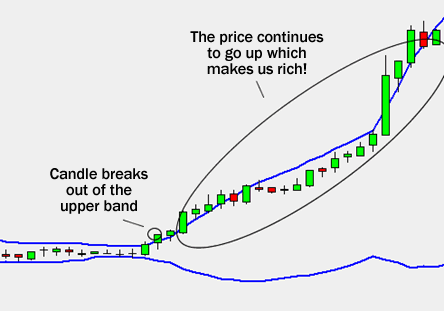
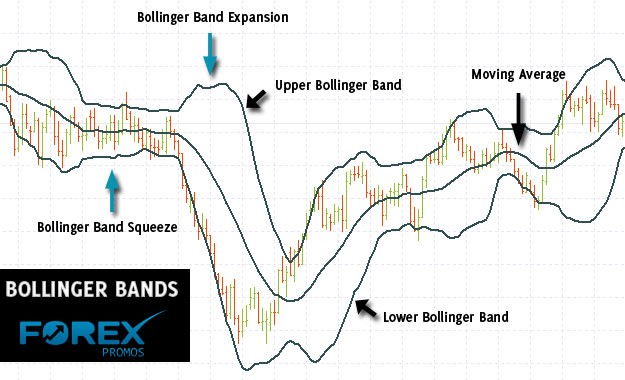
Bollinger Band Squeeze is a great pattern that enables you to locate strong and profitable trade setups. When the market becomes too slow and there is a low volatility. the price moves sideways and the Bollinger upper and lower bands become too close to each other. This is called Bollinger Band Squeeze. You can see it on all time frames, specially the shorter ones like 15min.
Sometimes Bollinger Band Squeeze is continued for several candlesticks. and sometimes it is only for a few to few candlesticks. It really does not matter how many candlesticks are inside the squeezed Bollinger Bands. Something that matters is that the market is not going to remain calm and quiet forever, and this low volatility will be followed by a strong movement definitely. This strong movement can be so profitable for us if we enter on time. In fact, the Bollinger Band Squeeze trade setups are really a great, because the movement that happens after the squeeze is usually too strong, and above all, we can enter with a very tight stop loss and wide target. In many cases we can take a 1:10 position which is great. In the other word, the Bollinger Band Squeeze trade setups are really profitable and have a great risk to reward ratio. On the other hand, it is very easy to locate such trade setups. You just need to be on time enough to enter when it is the right time.
Here I am going to show you a few of the Bollinger Band Squeeze trade setups and the way you could take them.
The blow chart shows a BB Squeeze example formed on EUR/USD 15min chart. You can see these kinds of patterns on the 5min and 15min charts a lot, and BB Squeeze is one of the most important strategies that many of the day traders use to trade. The below screenshot shows you how profitable these trade setups are.
As you see the Bollinger upper and lower bands became too close to each other for a few candles (the red arrows). Candle #1 is the center of this BB Squeeze which is a very short form of BB Squeeze.
Now the question is when we should enter the market when BB Squeeze forms on the chart?
We should take a position as soon as the market gets out of the range and starts moving strongly again. As you see, it has been moving sideways for several candles before the candle #1. Do you know what tells you that the market has decided to get out of the range and wants to start moving strongly again? The answer is in Bollinger Band itself. It tells you when to enter:
You take a position as soon as the body of one of the candles touches either the Bollinger upper or lower band. If it touches the upper band, it means the market wants to break above the range and go up. If it touches the lower band, it means the market wants to break below the range and go down. The candles body should touch the upper or lower band and should close while it is still touching the band. I mean touching by the candle shadow is not enough. The body should somehow break the band.
As you see on the below screenshot, the candle #2 body has barely touched the upper band. We could go long at the close of this candle. However, as the body has not touched the upper band strongly, we would wait for another candle to form. The candle #3 body has strongly touched the upper band. It does not have to be that strong and if I wanted to trade this BB Squeeze trade setup, I would go long at the close of the candle #2 or while the candle #3 was forming. The entry would be somewhere around the 1.36194 level. I would place the stop loss at the candle #2 low price or a little below it. It would be a 2 to 5 pips stop loss. The market went up for 50 pips after the BB Squeeze breakout. That is why I told you that BB Squeeze setups are really profitable and have a great risk/reward ratio .
The below chart shows two examples of BB Squeeze that are longer than the above example. I mean the market has been moving sideways for a longer time.
The one at the left side of the chart has something more than an ordinary trade for you to learn. As you see, after such a long time of moving sideways and inside the squeezed Bollinger Bands, candle #1 body touches the upper band. According to what I told you above, we would go long at the close of this candle and the stop loss had to be below the low price of the candle. However, as you see it would not work and the market went down and triggered the stop loss. I brought up this example here to tell that even the BB Squeeze patterns sometimes dont work. That is why we must always have a reasonable stop loss there to protect our money .

Although our first entry did not work and we lost about 12 pips, the market goes down and candle #3 touches the lower band while the BB Squeeze is still there and the upper and lower bands are still moving parallel to each other. So we could go short at the close of the candle #3. As it is a long candle, the stop loss did not have to be at its open price and it could be set at the middle of the candle (a 9 pips stop loss). A 90 pips target (1:10 position) could be easily triggered because the price goes down for 100 pips after the candle #3 close.
The second BB Squeeze at the right side of the chart is the example of a BB Squeeze that we should not take. The reason is clear. The candle that its body has touched and broken out of the Bollinger lower band (candle #4) is a too long candle, and usually the price turns around when such candles form on the charts. We need normal candles to trade. Huge and exotic candles are usually troublesome.
The last thing I have to emphasize about the Bollinger Band Squeeze is that sometimes the market becomes too slow, but it is not moving sideways completely and the candles row make an angle with the horizontal line while the BB Squeeze forms on the chart too. Youd better to avoid this kind of BB Squeeze setups and wait for the ones that the candles are moving completely horizontal, like the above three examples that I showed you.
This is what I wanted to share about the Bollinger Band Squeeze for now.
Don’t Miss Our New Articles!
Be the first who receives our most recent articles:
Learn more:


