Using technical analysis forex trading
Post on: 8 Октябрь, 2015 No Comment

Using technical analysis forex trading
What is technical analysis?
Technical analysis is the study of price charts in order to gauge market sentiment and the future direction of price. Unlike fundamental analysis, which focuses on the underlying drivers of supply and demand in currency markets, technical analysis looks at the repetition of patterns and cyclical movement of prices in order to determine potential trade setups.
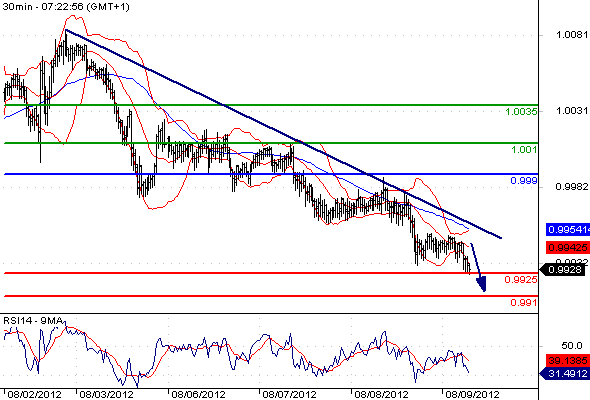
The principal tools for any technical trader is a forex price chart, which can be embellished through a wide range of technical indicators to help traders’ spot potential opportunities. These chart patterns and indicators benefit from being highly popular among many traders, including the large financial institutions, making them even more reliable in predicting future price movements. In this sense, many of the popular setups become self-fulfilling due to the large number of technical traders executing trades on a single setup.
Using technical analysis to gain an edge
Technical analysis takes some studying to become fully fluent in spotting technical setups within the market. Many of these have been tried and tested over decades and this gives forex traders an additional edge in the market when a specific chart pattern occurs. In addition to chart patterns, technical indicators such as moving averages, oscillators and Fibonacci tools come as standard with almost all charting packages. These can be applied to the price charts to enhance the information that a forex trader has available and form the basis of many trading profitable trading strategies. A profitable setup, such as a bearish reversal pattern, seen on a price chart can therefore be reinforced by a bearish reading on the accompanying indicator to confirm that a short trade will have a high probability of success.
Double Top Pattern
Technical chart patterns

Technical chart patterns develop as a result of the buying and selling of a currency pair over a period of time. These patterns are visible on any time-frame and provide an indication of a forthcoming bullish or bearish trend. Once these patterns have completed their formation, they provide setups which have a high probability of success and support the theory that history has a tendency to repeat itself in the forex markets. Some of the most popular patterns, such as the double-top and double-bottom, indicate market reversals and allow new trends to form which can be mapped on a price chart to prove additional trading opportunities. Other tools, such as the Fibonacci levels in the chart below, provide trading opportunities by creating support and resistance zones.
Fibonacci levels provide technical support and resistance
Technical indicators
These groups of indicators can be used in many ways as part of a successful trading strategy. Trend-based indicators provide and edge in ensuring that trades are taken in line with the underlying market sentiment and can also show traders when price is likely to correct or reverse. Momentum indicators fluctuate on a scale which alerts traders, through an algorithm related to recent price movements, when a currency pair may be considered overbought or oversold, and therefore ready for reversal.


