Using Pivot Points In Forex
Post on: 28 Апрель, 2016 No Comment

Written by Nick Buzby
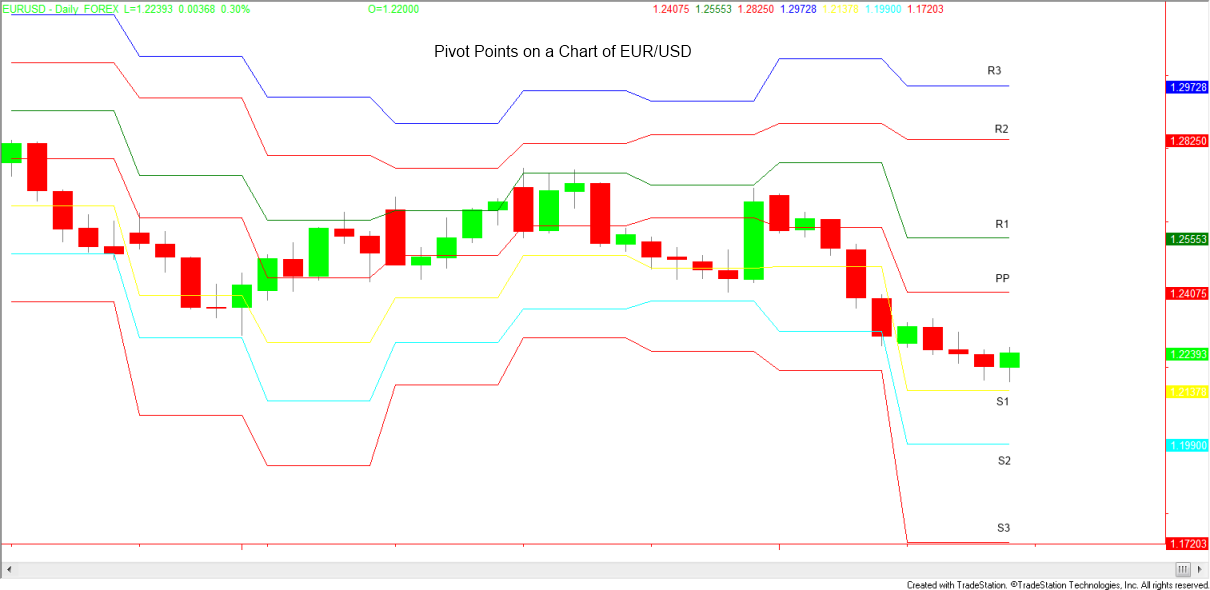
Pivot points have proven themselves to be effective in currency trading, they are short term trend indicators used by day traders as a predictive tool to forecast the current day’s support and resistance levels based on the previous days high, low and close levels (at 5 PM NY time).
The pivot point itself is the main support/resistance level what means that the most significant price movement is expected to occur at the pivot point itself.
Support levels S1, S2, S3 and Resistance levels R1, R2, R3 are less influential.
Pivot points are valid for one trading day and need to be recalculated based on prices at 5PM NY time (EST), they enable forex day traders to quickly calculate currency levels that are likely to cause price movement. Pivot points are yet another useful tool that can be added to a forex trader’s toolbox.
Using Pivot Points in forex trading
The most popular and most successful form of forex pivot trading is based on reversals. Simply put, when currency price approaches a pivot point above, a currency trader looks for a reversal at that point and sells the currency pair. The opposite is true when price action is moving downward. The pivot point trader waits for a bounce off the pivot of support.
Please note that the accuracy of using pivot point reversal strategies increases when Japanese candlestick formations can also be identified.
If a currency pair trades at the R2 or S2 levels, pricing will exhibit a tendency to trade back toward the central pivot point. Hence, traders tend to avoid buying high (at R2) or selling at the low (S2), they will look for market reversals at these levels.
R3 and S3 are extreme support and resistance levels, traders will not try to buy at R3 or sell at S3 because they are very overbought(R3)/oversold(S3), rather, traders will look only for reversals at these levels
Reversal Trade example
EUR/USD shoots up above the Pivot while simultaneously creating a reversal candlestick formation (such as a Evening Doji Star, Bearish Harami or Dark Cloud Cover), a trader can sell short @ 1.2853 with stop above the high of the candlestick formation @ 1.2871 and target @ S1 (1.2805)
Support and Resistance level Calculations (Based on previous day 5PM NY time)
Pivot Point (PP) = main support/resistance level, most significant price movement is expected at this point.
Pivot point = High + Low + Close/3
(R1) and support (S1) levels which assumes that trading will continue in the same range as the previous day (sideways trading).
Resistance R1= (Pivot point *2) Low
Support S1 = (Pivot Point *2) High
R2 and S2, levels assumes that the price breaks through the previous days trading range and continues until it meets a second higher level of resistance or lower level of support. Traders will look for reversals at these levels because most of time, currency price is now overbought(R2) / oversold(S2). Overbought and oversold market conditions can be confirmed with indicators such as MACD, RSI.
Resistance R2 = Pivot point + ( R1 — S1)
Support S2 = Pivot Point — ( R1 — S1)
R3 and S3 are extreme support and resistance levels, traders will not try to buy at R3 or sell at S3 because they are very overbought(R3)/oversold(S3), rather, traders will look only for reversals at these levels. A reversal trading signal can be found with indicators such as MACD, RSI. or Candlestick Formations for example.
Resistance R3 = High + 2*( Pivot Point — Low)
Support S3 = Low — 2*( High — Pivot Point)
Midpoint Level Calculations (Based on previous day 5PM NY time)
Midpoints generate trading levels between S1 and S2, S1 and Pivot, R1 and Pivot, and R1 and R2. They are only useful when the trading range isn’t too narrow.
Midpoint M1= (S2+S1)/2
Midpoint M2= (S1+PP)/2
Midpoint M3 = (R1+PP)/2
Midpoint M4 = (R2+R1)/2
Example: Take for instance the following GBP/USD prices from previous day close:


