Using Fibonacci Retracements to Find Forex Trading Entry Points
Post on: 27 Июнь, 2015 No Comment

The Fibonacci reteacement tool, available in most trading platforms, is very useful. Using it correctly and regularly provides a context for forex market moves (and other markets as well), helping to establish where retracements/pullbacks are likely to end, and the trend resume. Throughout nature we see a repeating pattern, based on a series of numbers which Leonardo Pisano Bogollo introduced to the West. The number series is based on the Golden Ratio, found in galaxy formations, plant growth and man made structures. These “Fibonacci levels” are also found in financial markets, and can help us determine where the market is going. No indicator should be used in isolation, but by combining it with trend analysis (so you are taking trades in the right direction) it helps highlight logical areas for forex entry points.
Forex Fibonacci Retracement Tool
When the price of an asset pulls back, that pullback typically has a mathematical relationship to the price wave that preceded it. This relationship is based on the Golden Ratio and a series of Fibonacci Numbers which help define the numerical relationship of one thing to another.
The Fibonacci Retracement tool is drawn over one price wave (impulse) to provide a context for how far the pullback that follows it will go, before the trend (impulse direction) resumes again.
Common Fibonacci Retracements levels are 23.6%, 38.2%, 50.0%, 61.8% and 78.6%, with the most popular being 38.2 and 61.8, but 23.6, 50 and 78.6 also appear appear quite often.
Most often these numbers are rounded in off in actual trading, since they only provide an estimate of where the retracement is likely to go.
Think of these number this way. If the USD/JPY moves 100 pips higher, from 101 to 102 then a 23.6% retracement means the price pulls back (about) 24 pips to 101.76. A 50% retracement means the price pulls back half of the prior advancesince the original advance was from 101 to 102 a 50% retracement of that brings the price back to 101.50.
Fibonacci retracements are most accurate on popular and highly liquid currency pairs. A low volume currency is more swayed by individuals (and not a large group of traders) and therefore may have erratic movements which dont align with the Fibonacci retracement levels.
To apply the Fibonacci Retracement tool to your chart, select it in your trading platform (in MetaTrader: Insert >Fibonacci>Retracement, or simply click on the icon on the toolbar). For an uptrend or impulse wave higher, put the 0.0 at the wave high and the 100 at the wave low. For a downtrend, or impulse wave lower, put the 100 at the top of the wave and the 0.0 at the bottom. This will provide you with the potential retracements for the pullback following the impulse wave.
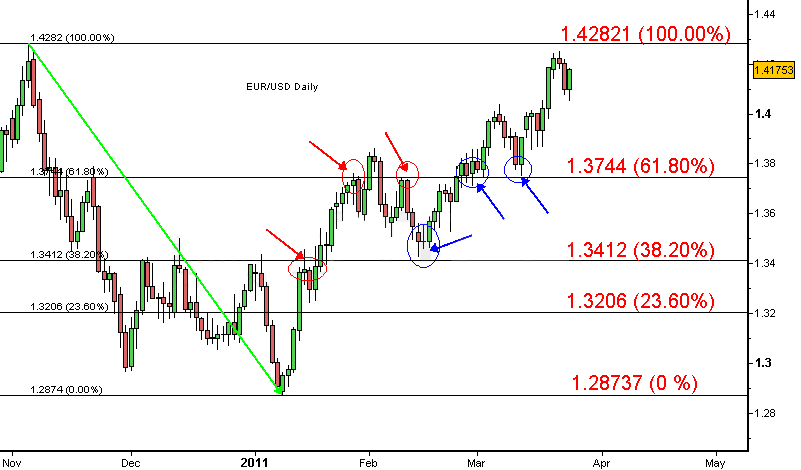
The Fibonacci Retracement is applied to a EUR/USD daily chart in Figure 1.
Figure 1. EURUSD Daily Chart with Fibonacci Retrecement Levels
Figure 1 shows the Fibonacci Retracement tool applied a price move higher (100 at low and 0 at high). The tool then provides areas where the pullback is likely to stall (later, which level(s) have the highest probability of causing the reversal will be discussed). In this case, the price stalls at the 61.8 level, and then resumes moving higher.
Once a new wave forms, you can delete the old Fibonacci retracement tools to avoid cluttering the chart. Although, you can use multiple Fibonacci Retracement levels on different time frames and on different scales to keep track of where longer-term moves may go.
Interpreting Fibonacci Retracements in Forex Trading
Once an impulse wave has occurred, and the tool has been applied to it, the price will quite often move to and stall at one of Fibonacci Retracement levels. If the price falls through one level it will likely proceed to the next level. Occasionally, a price may stall at one level, then proceed to the next, stall and proceed to the next and so on. During such times it is important to have some guidelines on which levels are likely to be most important in certain market conditions (this will require a lot of practice and chart study).
In a very strong trend, expect shallow pullbacks, to 23.6, 38.2 and sometimes 50. In normal trends, or during the middle of a trend expect a pullback to the 50 or 61.8 levels. Early in the trend (figure 1), late in the trend or during weak trends expect retracements/pullbacks to reach the 61.8 or 78.6 levels.
We cant know in advance which Fibonacci level will stall the pullback, but by looking at the tendency of the price action and how strong price movements are, the above guide can help isolate where the pullback is likely going.
Fibonacci Retracement are a guide; dont expect the price to stop exactly at a level. In figure 1 for example the price slighly over-shoots the 61.8 level. It is typical for the price to stall just above or below a Fibo level.
Figure 2 shows the tool applied to consecutive waves on a EURUSD Daily chart.
Figure 2. EURUSD Daily Chart with Multiple Fibonacci Retracements
In figure 2 the tool has been applied to each price major impulse wave higher, although it can also be used to on multiple impulse waves or price movements on any time frame.
Figure 3 shows the tool applied to the entire move higher showed in figure 2. The most recent pullbacks comes very close to the 38.2 level before resuming to move higher.
Figure 3. Fibonacci Tool Applied to Broad Trending Move (EURUSD Daily)

While daily charts have been used in these examples, the tool can be applied to any time frame, including ticks charts, 1-minute charts or weekly charts. It can also be used on any market (not just forex), and applied to individual price waves or multiple price waves (for a broader perspective, like in figure 3).
Basic Fibonacci Retracement Strategy
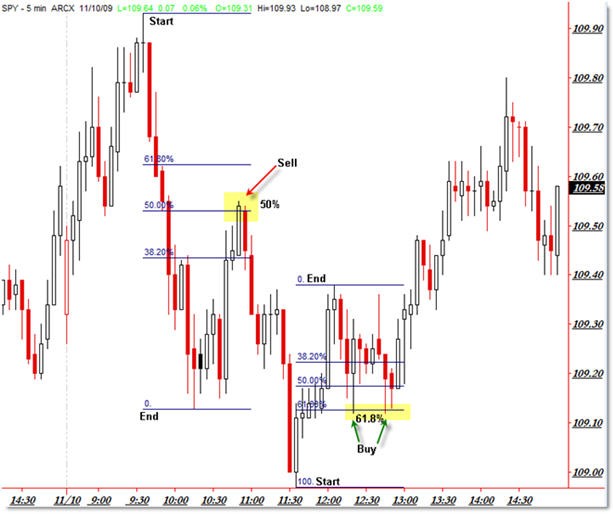
In an uptrend buy when the price pulls back and stalls near one of the Fibonacci retracement levels, and then begins to move back to the upside. Place a stop loss just below the price low that was just created, or below the next Fibonacci retracement level to give a bit more room.
In a downtrend sell when the price pulls up and stalls near one of the Fibonacci retracement levels, and then begins to move back to the downside. Place a stop loss just above the price high that was just created, or above the next Fibonacci retracement level to give a bit more room.
Looking at how strong the trend is can help determine which Fibonacci levels are most likely to stall and hopefully reverse the pullback. Recall:
In a very strong trend, expect shallow pullbacks, to 23.6, 38.2 and sometimes 50. In normal trends, or during the middle of a trend expect a pullback to the 50 or 61.8 levels. Early in the trend (figure 1), late in the trend or during weak trends expect retracements/pullbacks to reach the 61.8 or 78.6 levels.
This is only a guide though, determining what levels are most likely to hold will require a lot of study in regards to price action and tendency.
In September 2013 the AUDUSD experienced an aggressive rally after a long downtrend. Due to the aggressive nature of the rally a shallower pullback was expected, likely to the 23.6 or 38.2 level. Figure 4 shows how the pullback unfolded. At first it stalled it at the 23.6 level, but then fell through and proceeded to the 38.6 level where the pullback stopped and another move higher ensued. Entering long near the 38.2 level (once the price started moving higher off of it) with a stop just below the recent low is a one potential way to use Fibonacci Retracements for finding entry points. Using an additional strategy to filter signals highly recommended.
Figure 4. AUDUSD Fibonacci Retracement Trade Example
If the price retreats all the way to the 100% level, that means the entire prior move has been retraced, and shows a larger consolidation is occurring or the trend on the same degree as that wave is in jeopardy. For more degrees see How to Channel Impulse Waves on a Price Chart
The Final Word
Use the Fibonacci retracement tool on all timeframes, from minute charts up to monthly. It is a trend following tool, and helps isolate where pullbacks are likely to end and the trend resume. Dont place all your trust in it though. The price may not stop exactly at a Fibonacci level, rather it is just guide. Sometimes the price will completely disregard Fibonacci levels, often when major news occurs. Dont try to force a tool to work that isnt. Only use the Fibonacci retracement tool in conjunction with price analysis and as part of a complete trading plan.
Also use Fibonacci math to find forex profit targets, using the Fibonacci Expansion tool: Use the Fibonacci Extension Tool to Find Targets and Likely Reversal Points


