Use the Fibonacci Extension Tool to Find Targets and Reversal Points
Post on: 21 Апрель, 2015 No Comment

The Fibonacci extension tool, available in most trading platforms, can be very useful. Using it correctly and regularly provides a context for market moves, helping to establish profit targets on trending trades or being aware of where reversal areas likely are. Throughout nature we see a repeating pattern, based on a series of numbers which Leonardo Pisano Bogollo introduced to the West. The number series is based on the Golden Ratio, a number found in galaxy formations, plant growth and man made structures. These Fibonacci levels are also found in financial markets, and can help us determine where the market is going.
Fibonacci Extension Tool
There is some interesting history behind Fibonacci numbers, and trading tools utilizing them, but ultimately we dont need to know this history to trade. If you are interested in the history and further application of Fibonacci tools, one of the premier books on the subject is now available for free download: Elliott Wave Principle eBook .
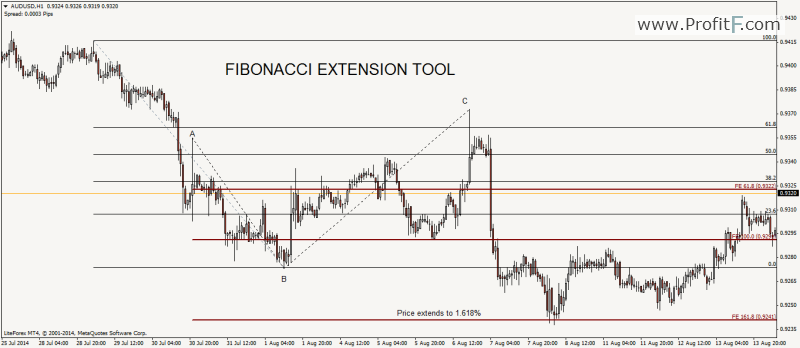
The Fibonacci Extension tool is applied to one wave of a price move, which in turn helps to predict where future waves in that trend is will go to and possibly reverse.
I utilize the following Fibonacci extension levels on my chart:
61.8%, 100%, 138.2%, 161.8%, 200%, 238.2%, 261.8%
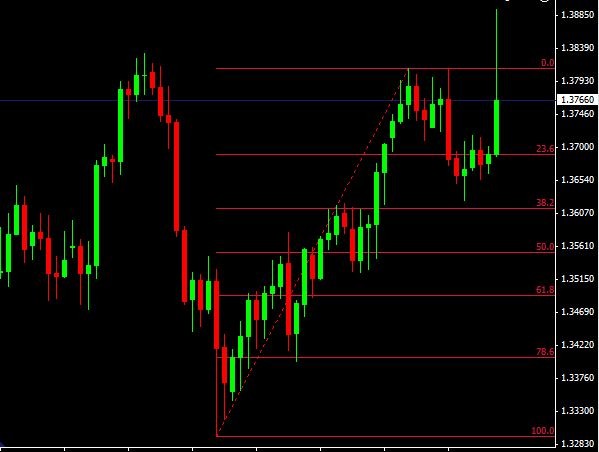
To use the tool, youll need to apply it to you chart; how to do this will vary by trading platform. In MetaTrader4, go to Insert, then Fibonacci and select Expansion. To apply the tool to an uptrend, click at the bottom of a price wave, and drag the tool to the top of the price wave. Youll notice the Fibonacci extension has two lines, the first you is the one you just drew from the low to the high. The next line is draw to the low of the current retracement.
Figure 1 shows a Fibonacci extension tool applied to a price wave in an uptrend. It starts at the bottom, connects to the top and then the second line of the tool reaches down to the low of the retracement following the wave higher. The tool then helps predict where the next up wave is likely to go.
Figure 1. EUR/USD Daily Chart with Fibonacci Extension Tool
Fibonacci Extension Tool on EUR/USD
Double click on the tool to move it or edit it. Drag the white dots on the indicator to line them up the relevant highs and lows in price. You can also right click on the indicator to bring up the properties of the tool. From there you may need to add some of the Fibonacci extension levels mentioned prior, since they may not all be included by default.
Once you have drawn the tool once, youre going to need it several more times throughout the day. Instead of going through the menu again, In MetaTrader you can simply click on the tool so it is selected, then hold down the Ctrl key and left click on the tool. This will duplicate the tool, and then you can just drag the duplicate to where you need it and adjust it the relevant highs and lows of the new price wave.
The Fibonacci Extension tool can be applied to any market, and any time frame. To see Fibonacci Extensions and Fibonacci Retracements applied to a stock, read: A Classic Impulse Wave in General Electric (GE)
Finding Potential Reversal and Target Areas with Fibonacci Extension Tool
Figure 1 above shows the Fibonacci extension tool applied to an up wave. When the price continues higher it stops very close one of the extension points61.8and then reverses.
The level the price stops at will vary depending on the strength of the trend. Most often we see the price pause or reverse at 61.8, 100, or 161.8 of the most recent wave. Once the reversal occurs we can then draw another Fibonacci extension, but we will keep the old one(s) on the chart as well, since down the road there are additional levels which can still be used such as the 200, 238.2, 261.8 and 300.
Figure 2 is the same chart as above, except another Fibonacci extension tool has been added to the next price wave.
Figure 2. EUR/USD Daily Chart with Fibonacci Extensions
2 Fibonacci Extensions on EUR/USD
Once the price starts to move higher, we can draw a second Fibonacci extension, as shown in Figure 2. Even with using two tools at the same time, the chart can start to get cluttered. Therefore, we look for areas where the most Fibonacci levels are clustered. Since we are assuming the uptrend will continue, we look for these Fibonacci clusters above the former high.
I have circled a second area in grey, which is where we have three Fibonacci levels in close proximity to one another. The price stalls in this area, and then reverses.
We can continue to repeat this process drawing a new Fibonacci expansion on each new price swing. When the price reverses we draw the expansion tool to forecast the emerging downtrend.
Figure 3. EUR/USD Daily Chart with Fibonacci Extension
Fibonacci Extension Tool Applied to Downtrend in EUR/USD

Fibonacci Extension Tool Considerations
The tool can be applied to any time frame, from tick charts all up to daily or monthly charts; no matter what timeframe you trade on the application of the tool is the same.
Use the Fibonacci extensions tool to provide profit targets on trending trades. Typically I will use the 61.8 or 100 level, and but if the market is moving very strongly I may adjust the target to the 161.8 level. All the levels mark areas where the price could quite possibly stall or reverse, which is why we want to exit slightly before the price reaches these levels.
Dont anticipate at what level the market will stop. Sometimes it will charge through the 61.8 level and proceed to the 100 level. Other times it will move right to 161.8 level before stalling. Each level marks an area of potential support/resistance. If the price moves aggressively through a Fibonacci extension level, then it is likely heading toward the next one.
Apply the Fibonacci extension tool to multiple waves, and even different time frames to be aware of different levels which may affect price. For example, apply the tool on a daily chart, and the also apply the tool to your 1, 5 or 15 minute time frame when trading.
Once youve draw three Fibonacci extensions, you can start to delete the first ones you drew, since your chart will become too cluttered and youll have levels all over the place which is of little value. Also, if your chart is too cluttered, you can delete any old Fibonacci drawings where the price is past the 161.8 level.
Over 300 pages of Forex basics and 20+ Forex strategies for profiting in the 24-hours-a-day Forex market. This isn’t just an eBook, it’s a course to build your skill step by step.
You May Also Like:
Moving Averages and the Wave Principle The lesson provides a powerful example of how moving averages can strengthen your ability to identify Elliott Wave Patterns.
Top 3 Technical Tools Part 1: Japanese Candlesticks – A very basic introduction to candlesticks along with what to look for when using them for trend trading.
Top 3 Technical Tools Part 2: Relative Strength Index (RSI) – Using RSI support and resistance levels to find trending trading entry opportunities.
Top 3 Technical Tools Part 3: MACD – Using MACD signals along with candlestick patterns and the trend to find quality trade setups.


