Use Heikin Ashi Charts to Filter Out Market Noise
Post on: 16 Март, 2015 No Comment

Ever catch yourself trading small irrelevant moves, where your chance of being profitable is pretty much random? This is usually a result of trying to trade market noise, instead of significant trending moves where your odds are significantly improved. Market noise is the small moves which occur constantly throughout the day, distracting you from the primary trend, getting you into trades (and out of as well) too early. One way to filter out some market noise, so you can see trends more clearly, is to use Heikin Ashi charts.
Heikin Ashi (HA) Chart Basics
HA charts are similar to Japanese Candlesticks, except that HA charts essentially average two bars worth of data into one. For example, on a daily chart, the HA chart uses the open and close data from the prior day, as well as the open, high, low and close from the current day to create a price bar. This filters some of the market noise, since youre seeing more of a short-term average price instead of precise daily prices.
Even though HA charts are similar to Japanese candlesticks, most Japanese candlestick chart formations arent applicable to HA charts. HA charts are generally used to identify trending periods, but can also be used for traditional technical trading methods such as triangle breakouts or correction breakouts.
Figure 1 shows an HA USD/CAD chart (top) compared to a Japanese Candlestick USD/CAD chart (bottom). Notice how the HA chart presents a better visual of the trend, when a trend occurs, and how the price movement is less choppy.
Figure 1. HA USD/CAD (top) vs. Japanese Candlestick USD/CAD (bottom) Daily
Also, you wont see gaps on HA charts. The traditional USD/CAD chart above doesnt have any pronounced gaps, but if there was, the HA chart would simply have a larger price bar instead of the gap.
Interpretation
One of the main uses for HA charts is to make the trend more visible by averaging out small moves against the trend. I have colored my charts green for up and red for down, so a long green candle indicates strong buying interest over the last two days. If the bar doesnt have a long lower shadow (the thin line that comes out of the fat part of the candle), that also indicates strength.
On the flip side, a long red candle indicates strong selling over the last two days. If the bar doesnt have a long upper shadow, that also indicates weakness.
On a traditional chart, when you see a red bar and green bar next to each other, the HA chart will show this as indecision by creating a candle which typically has long shadows on either side with a small candle body (fat part of the candle).
Figure 2 shows a strong trend, as the bars are long and green with no lower shadows (for the most part) and there are only very short periods of indecision (small bars with upper and lower shadows).
Figure 2. HA Dow Jones 30 Chart Daily
Heikin Ashi Patterns
Just like traditional charts, with HA charts you can watch for breakouts above or below resistance/support or out of a technical pattern such as a triangle or channel.
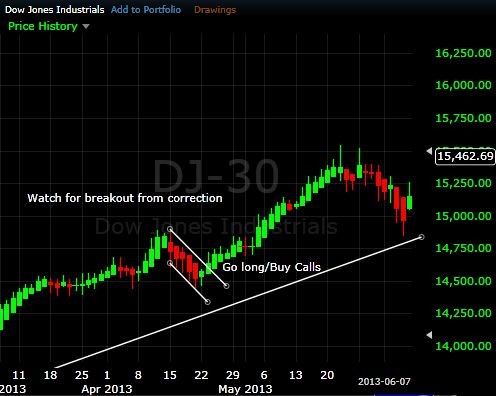
For instance, during a strong uptrend watch for breakouts to the upside after a correction. In Figure 3 I have drawn trend lines along the correction, creating a channel. When the price moves above that channel it is a signal to go long or buy calls.
Figure 3. HA Dow Jones 30 Correction Breakout
Also use HA charts to watch for breakouts from traditional chart patterns, such as ranges, triangles or wedges. Figure 4 shows the EUR/USD breaking lower out of a wedge formation. The downside breakout of the pattern indicates selling pressure and therefore youll likely want to get short or buy puts.
Figure 4. HA EUR/USD Wedge Breakout
Considerations
One of the most important things to remember about using HA charts is that each bar is an average. Therefore, the current price you see on the side of the chart is likely also an average, and not the real-time price. Therefore, I recommend using HA charts in conjunction with traditional charts.
Use HA charts to see trends more clearly, and to trade breakouts which may not be as clear on regular charts. Alternatively, use HA charts simply for confirmation of the pattern of the patterns you are trading on your traditional chart.
When entry and exit prices matter though, make sure you are trading off the current-real time price, and not off the HA price which will be average of the last two periods.
Final Word
HA charts smooth out the price data and make it easier to see trends and often breakouts as well. These charts are best used in conjunction with traditional charts for trade confirmation, trade signal or trend following purposes. Just because the data is smoothed out a bit doesnt mean you wont get false breakouts though. Even though the chart looks different, price can still abruptly change direction. Get used to using HA charts on a charting platform or demo account before trying to apply HA techniques with real money.


