Triple Top Chart Pattern
Post on: 21 Май, 2015 No Comment

You are here. Forex Learning Center > Level MEDIUM > Chart Patterns
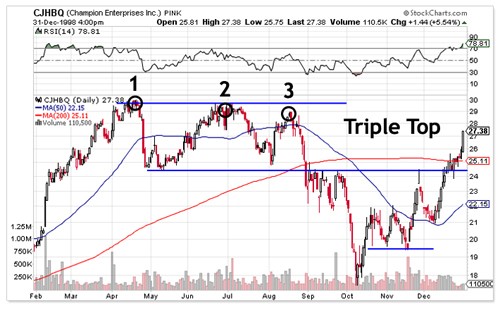
The triple top is an bearsih pattern with a MN shape. Three bottoms will succeed, reflecting an important resistance. This marks a reversal will.
For the triple top below, the area of resistance will lead to a correction of the price thee times. The neckline of the pattern will be formed by the lowest of the two bearish peaks. A first correction will therefore occur and, thereafter, the price will go back on the resistance. The amplitude of the three tops is normally the same (as in the case below), but it may happen that the first top is lower than the next two. This configuration reinforces the validity of the pattern because it reflects a breathlessness of buyers.
Please note, if the second top is higher than the two others, it may be a head and shoulders pattern.
A second correction will then take place, theoretically on the same level as the first correction. If the neckline is broken at this point, then it can be a double top. That’s the difficulty. In some cases, we know afterward to what type of pattern we were facing. A return on the resistance must be done. However, the third top could be higher than the first two and that reinforces the chances of reversals (breathlessness of buyers). This is the third correction that will lead to the breakout of the neckline and validate the bearish reversal.
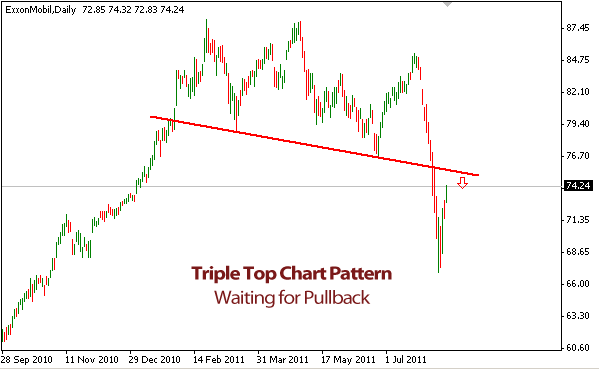
Once the neckline is broken, it may happen that the price take resistance on it (that line becomes a resistance, it is called a pullback), and then the price took up its bearish movement. The target price is determined by the gap between the resistance and the neck line.
Here is another example of a triple top with a breathlessness of buyers (top are less and less high):
Statistics
Here are some statistics about the triple top :
- In 85% of cases, there is a downward exit
- In 50% of cases, the target of the pattern is reached once the neckline broken
- In 84% of cases, a pullback occur
- In 85% of cases, there is a pursuit of the movement once the neckline broken
Different types of triple bottom
They are different types of triple top that we can classified according to three criteria:
- The shape of the top: The top can be V-shaped (known as Adam top) or U-shaped (this is called Eve top).
- The level of the second top: The second top may be higher, at the same level or slightly lower than the first top
- The level of the third top: The third top may be higher, at the same or lower than the second top.
Unusual case �������
If the increase between the two first top is greater than the decrease between the last two, then it is advisable to draw an upward slant to connect the two low points. This is the neckline of your pattern.
Notes
- In case of pullback, the downward movement will be less important once the target of the pattern is reached
- If the resistance is lengthily tested before a correction (flat top), then the decrease following the breaking of the neckline will be more important
- More the three top are close, more of the percentage of success of the pattern is high
- More movements between the neckline and resistance are straight, more the pattern is efficient
- More the bullish movement that preceded the formation of the triple top is big, more the downward movement at the breakout of the neckline will be strong.
- The pattern is more efficient if the third top is less higher than the two others

Trading Strategies
The classic strategy:
Entry: Take a short position at the breakout of the neckline
Stop: The stop is placed above the neckline
Target: Theoretical target of the pattern
Advantage: The percentage to succeed is important
Disadvantage: Pullbacks exceed the neckline in many cases. Thus, a stop too close can be reached stupidly. To remedy this, it is possible to wait for the pullback onthe neckline to take a stand. This allows a better set of your stop.
The aggressive strategy:
Entry: Take a short position after the second top or third top
Stop: The stop is placed above the lowest bottom
Target: Return on the neckline
Advantage: The ratio profit/risk is high, indeed, the stop is close
Disadvantage: The percentage of a losing trade is more important because the pattern is not confirmed yet.
Others Chart Patterns.


