Triangle Chart Patterns in Forex Trading
Post on: 11 Апрель, 2015 No Comment

One of the most complex aspects of forex trading is technical analysis and basing a trade on that. There are many types of forex charts that are followed and various types of interpretation that can be drawn from there. While some charts can signal a short-term trend. there are others that denote longer patterns. The benefit of these charts is they do not leave anything for imagination, they spell out clearly what the trend is going to be and it helps you to prepare in advance and set your strategy in motion once you can see the pattern setting. Let’s analyze of the most commonly used patterns, the Triangle Chart.
The Triangle Chart signals the convergence of two trend lines where the price moves between these two lines and mainly three kinds of trend movement is seen, a flat line, ascending or descending. Thus, essentially you get three main types of triangle chart, Symmetrical Triangle. Ascending Triangle & Descending Triangle .
Symmetrical Triangle
A Symmetrical triangle is essentially a continuation pattern. It is a great tool to signal a consolidation phase followed by eventual resumption of movement in a specific trend. You get this kind of a Symmetrical pattern when the resistance and the support line converge. The ascending line is generally the support line, and descending line signals the resistance levels. It is important that while the triangle is formed as a result of the convergence of these two trendlines. the slope or the gradient of these two lines should be similar. We will then see that the price of the currency pair will bounce between trendlines while these two lines converge at the apex point. A breakout is generally seen in the direction of the previous trend that was observed.
Bullish Symmetrical Triangle
Bearish Symmetrical Triangle
Let’s assume the previous trend was a downward trend, then traders who are following the chart need to look for signals below this ascending support line. However, if the prior trend was an upward one, your focus has to be for price moves that indicate a break above the resistance line or the descending line.
An example that might help you grasp this concept better is a study on GBP/USD four hours chart. If a symmetrical triangle is formed, it indicates that sellers are not able to push the prices lower, and the buyers are unable to push it up any further. When both the prices collide at a point, it is called consolidation. General trend indicates a breakout can be easily seen within the first two-third of a triangle at which point either the buyer or the seller take control. So what does a trader do once the triangle takes shape? Well, they would essentially watch out for a breakout above the key support or the resistance zone. After the charts do confirm a breakout, the next step is placing a stop loss below or above the last swing low depending on the trend that is seen.
Ascending Triangle
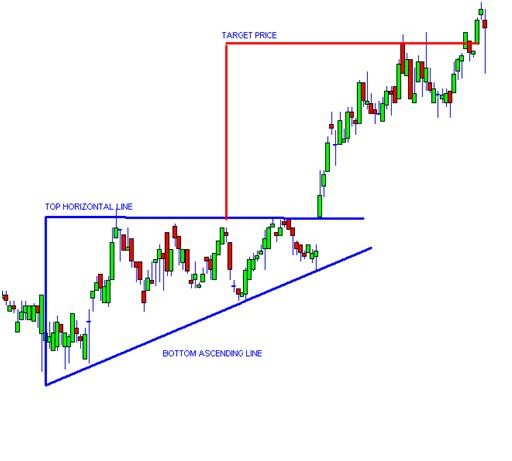
The second pattern of the triangle that is easily noticed is the Ascending Triangle. As is evident from the name, this kind of a triangle formation on the chart usually signals a bullish trend in the market and signals further upward movement of prices upon completion of this pattern. This kind of triangles is seen on the charts when the resistance zone signaled by the flat trendline converges with the ascending trendline. The ascending line signals the support price. As is seen in the case of Asymmetrical triangles, the price movement happens in between the two trendlines till a breakout happens when the ascending line moves further up. This kind of pattern is generally preceded by upward trend & signals a sure continuation of the pattern.
The key point of this pattern is the gradually rising support line which indicates that sellers are beginning to leave, and buyers are gradually taking control. Once the sellers are completely wiped out, buyers take the price past the resistance zone and continue the upward journey.
The trader approach in this case remains similar to Symmetrical Triangles. You must enter short if a breakout happens below the bottom of the pattern and your stop loss needs to be roughly 10 pips above the top of the recent high. Your profit target has to be close to the height of the pattern. If the prices have already rallied above the resistance zone, it is best to put a stop loss below the highest low within the pattern. Again this should be at least 10 pips below.
However a word of caution for all those who are basing their trade on this pattern, after the breakout is complete, there are chances that the price can fall below the support zone. If you are taking position just before a breakout you need to be alert and keep a cautious approach.

An ascending Triangles that is formed on a bullish market.
Descending Triangle
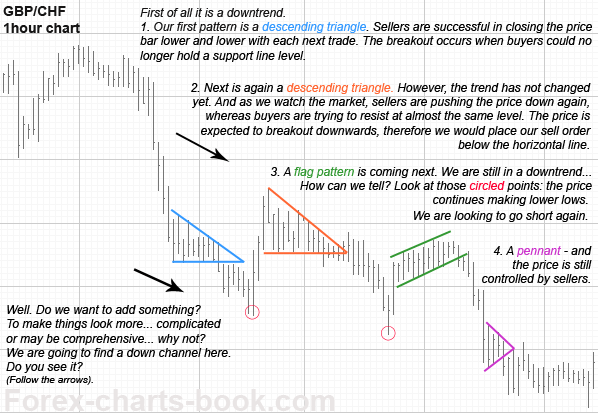
The final type of triangle formation that is immensely popular is the Descending Triangle. As you can deduce from the name, it is the exact opposite of the ascending triangle and contrary to the ascending triangle, it gives a bearish signal. It gives indication to the chartists on points from where the price will trend downward if the pattern is completed. The exact opposite of an Ascending Triangle, it is formed by the convergence of the support line which is flat and the resistance line which is going down.
This again is a continuation pattern and almost always preceded by a downward trendline. But again a similar formation cannot be completely ruled out in case of an uptrend. It is generally noticed that the initial part of the pattern sees a fall to lows from where the price is seen moving further up. Test of prior support zones is the next step of progress, and this again leads the currency pair to a previous high at a lower level. This process continues till the point where the price is not able to hold to the support zone any further and the downtrend continues.
The key inference from this type of chart pattern is that sellers are trying to gain control and buyers gradually fade away. When finally after several attempts to push prices higher, they fail, the sellers takeover and send the prices lower. The 10-pip threshold for putting in stop losses hold true for this pattern too as is the case with other triangle patterns. The 10-pip limit gives a trader that kind of leeway to prepare for an eventuality or time to asses the prospect of the forthcoming upmove that the markets are about to witness.
A descending triangle that is formed on a bearish market.
Thus, we can conclude that these Triangle Patterns on the chart are simple, easy to identify and effective tools to signal trend continuation. They provide strong risk-reward opportunities, and the trader can easily identify if a significant uptrend or a downtrend is setting in. These triangles also give you good idea of the profit target or the risk zone that you would be at the brink of approaching and can thus tweak your trade in a way that profit percentage is preserved while losses are kept at bay. Powered with knowledge of this kind of complex price pattern, you are further closer to your goal of maximizing the profit and sealing your future in forex.


