Trading the Head and Shoulders Price pattern
Post on: 25 Май, 2015 No Comment

Price patterns is the field of studying some recurring patterns that happen on the price chart, across different markets. Studying price patterns and especially getting familiar with some of the many patterns can build a profitable trading strategy.
Most beginners to forex usually tend to find themselves lost in tons of trading indicators, trading systems and lose out on the most basic and easy trading methodology. This article serves as an introduction for beginners to some simple price patterns that traders can test and use and see the results themselves.
Types of Price Patterns
Of the many kinds of price patterns available, they can all be classified into the following two self explanatory groups:
- Continuation Patterns
- Reversal Patterns
Bear in mind that when we talk about price patterns, we are referring to formations and have nothing to do with candlestick patterns which are entirely different. Thus, the price patterns we look for tend to happen over many different candle periods.
The Head and Shoulders Reversal pattern
The Head and Shoulders patterns, or H&S for short is a major reversal pattern that occurs at the beginning or at the end of the end and thus indicate a price reversal, aka the end of a trend. When such patterns occur on a chart, it hints at a conclusive end of a trend.
The H&S pattern occurs on any time frame, right from the 1-minute chart to the monthly chart. However, on which time frame the H&S pattern occurs and the preceding trend in play should be taken into consideration.
How does a Head and Shoulder Pattern look like
In an uptrend, a H&S pattern is determined by a high, followed by a higher high and lower high. Usually, the first high should see more volume than the next two highs. In effect, this pattern would look at depicted in the illustration below.
Head and Shoulders Pattern
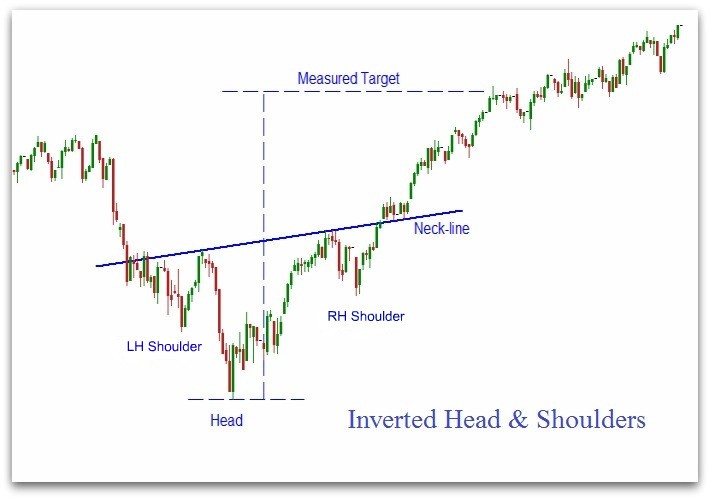
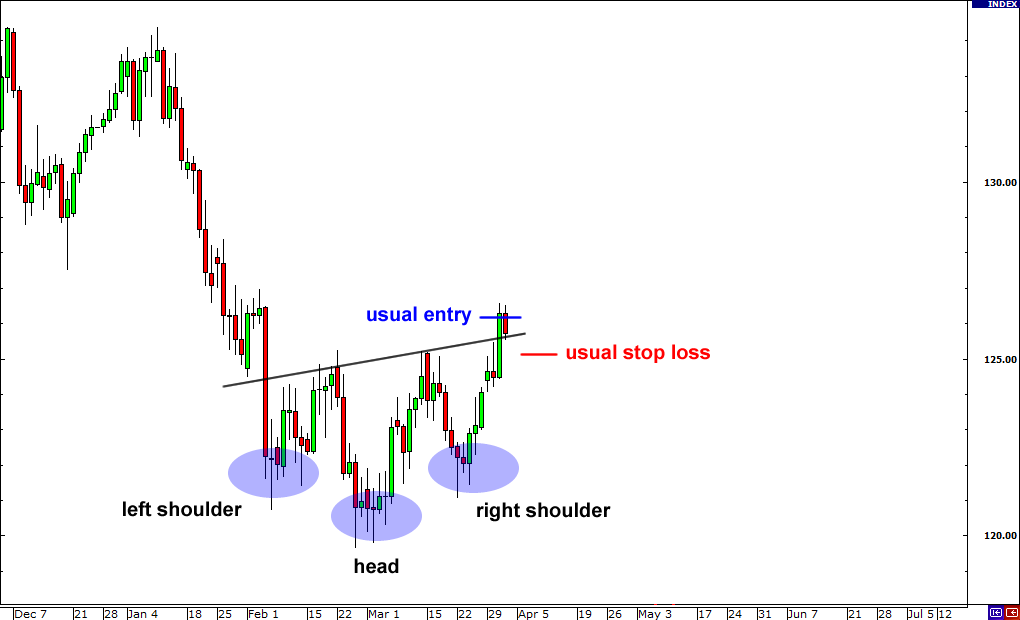
Likewise, in a downtrend, a H&S pattern is referred to as an inverted head and shoulders pattern. The inverted H&S pattern usually occurs at the end of a downtrend and signals a reversal. An inverted H&S pattern would thus look like the chart below.

Inverted Head and Shoulders Pattern
Having identified the head and shoulders and at which point in the trend it happens, traders can take a calculated trade based off this pattern alone. But there are some rules in order to validate the H&S pattern.
- For Stocks, Futures, the first high (or low) should be accompanied by heavier volume. The consecutive highs (or lows) should usually see relatively low volume. For the forex markets, this can be ignored.
- The time frame plays an important role. As such, always scan your charts from Monthly down to H4 and in the process make note of the underlying trend in play
- Neckline is an important validation rule. Price must close below (or above) the neckline. Ideally, look for one full candle open/close outside the trend line
- Neckline doesnt have to be a perfect horizontal line all the time. In most cases you will find a slanting neckline
Trade Entry, Stops and Targets using H&S Pattern
Enter the trade upon validation of a (inverse) H&S pattern. Enter when price opens outside the neckline with stops placed at the immediate significant high (or low, in case of a long trade). For target, measure the distance from the peak (head) to the point where the break of the neckline occurred and project the same distance from the break of the neckline.
Trade Examples
In the following example, we look at the GBPUSD Daily chart which saw an inverse head and shoulders pattern that was recently formed.
Inverted Head & Shoulders Pattern, GBPUSD Trade Example
From the above chart, after price made an inverted head and shoulders pattern, we wait until there is a clear break of the neckline and enter the trade at 1.54871. The stops would placed at the most recent significant low, which in this case is 1.52030, while the target is set at 1.58822 (which is 539.2 pips distance from the head to the point where price broke the neckline). In this trade, by using just the price pattern method, the trade would have given us a total of 395 Pips, with a risk of 284 Pips, 1.38 Risk/Reward ratio. The odds could have been improved had we taken an entry right after the break of the neckline, however by ensuring a full candles close outside the neckline increases the probability of a sure fire trade.
Final Notes
The H&S pattern is a high probability trade as its one of the often used trading pattern watched by many traders. It is a very simple and easy to use trading method that does not make use of any other indicators and is an absolute no-brainer.


