Trading Stocks with the MACD Indicator
Post on: 16 Август, 2015 No Comment

Stock Trading with Chart Patterns
Trading Stocks with the MACD Indicator
August 28th, 2011 Steve
The MACD indicator. or the Moving Average Convergence Divergence, is one of the most popular trading indicators, and it is used to generate buysell signals in Forex, stocks and commodities. In this article we will describe how the MACD indicator is calculated and how to use it to trade chart patterns profitably.
Type of Indicator
The MACD Indicator is generally a trend-following indicator, allowing you to capture trends and join the market in its big moves. In some methods it can also generate reversal signals, especially in the divergence method.
Formula for the MACD Indicator
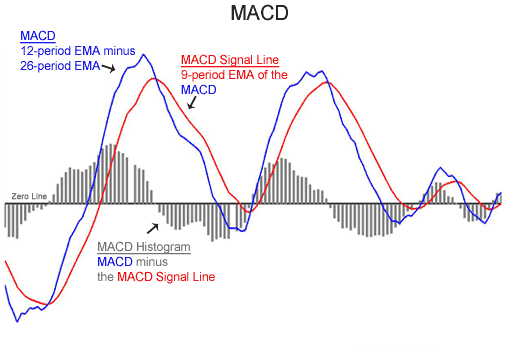
The Moving Average Convergence Divergence is basically showing us the difference between two expotential moving averages and presents this difference in the histogram. This value is also called by the main line.
This value is later smoothed by another 9-period expotential moving averages which creates the signal line.
How to Trade with the MACD
The most basic method of trading the MACD is using the signal-line cross method:
* Long trades are signaled when the main line crosses the signal line from below
* Short trades are signaled when the main line crosses the signal line from above
This is the most basic and trend-following approach of trading this indicator, and it works well on stocks that trend strongly and in phases of strong bullish or bearish moves. If the stock starts to range this trading tactic wont function well and you will lose money.
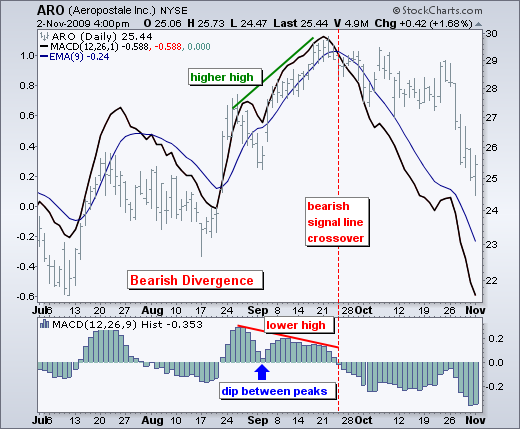
The next method to trade the Moving Average Convergence Divergence is in the divergence method.
The basis of this method is a divergence between the trend of the indicator and the trend of price: when the trend of the indicator is opposite to the trend of the stock. This is usually a sign of a weakness in trend, that indicates that the trend is about to reverse. For example:
This is a good counter-trend method that can give you early reversal signals of trends. However it is a bit subjective and it may be hard to identify, until it is too late. This is why it is recommended to confirm the divergence signals with some chart trading like supportresistance breakout or pullback.
Another trading method you can use with this indicator is the zero-line cross. This signal occurs when the main line crosses the zero-line:

* Long trades are signaled when the main line crosses the 0 level from below
* Short trades are signaled when the main line crosses the 0 level from above
The final trading method that uses this indicator is the saucer method. This signal occurs when the MACD trends in a direction and the histogram begins to trend up after a downtrend. These examples will explain:
These are powerful signals that are confirmed by the general trend, AND are slightly leading so they do give accurate signals.
Trading Chart Patterns with the MACD Indicator
The MACD can confirm chart patterns and give you a leading signal that price is about to reverse, or a certain chart pattern is about to break. Sometimes you can know a reversal is about to happen hours before it occurs.
The divergence shows us that the pattern is about to break hours before it happens, so we can prepare and look for counter-trend signals.
Conclusion
This indicator is a trend-following indicator that catches big trends, but as a result it is also a lagging indicator. Make sure to use it only on stocks that trend strongly, or to use it as confirmation and to gauge momentum of stocks.


