Trading Multiple Time Frames In FX
Post on: 16 Июль, 2015 No Comment

Most technical traders in the foreign exchange market, whether they are novices or seasoned pros, have come across the concept of multiple time frame analysis in their market educations. However, this well-founded means of reading charts and developing strategies is often the first level of analysis to be forgotten when a trader pursues an edge over the market.
In specializing as a day trader, momentum trader, breakout trader or event risk trader, among other styles, many market participants lose sight of the larger trend, miss clear levels of support and resistance and overlook high probability entry and stop levels. In this article, we will describe what multiple time frame analysis is and how to choose the various periods and how to put it all together. (For related reading, see Multiple Time Frames Can Multiply Returns .)
What Is Multiple Time-Frame Analysis?
Multiple time-frame analysis involves monitoring the same currency pair across different frequencies (or time compressions). While there is no real limit as to how many frequencies can be monitored or which specific ones to choose, there are general guidelines that most practitioners will follow.
Typically, using three different periods gives a broad enough reading on the market — using fewer than this can result in a considerable loss of data, while using more typically provides redundant analysis. When choosing the three time frequencies, a simple strategy can be to follow a rule of four. This means that a medium-term period should first be determined and it should represent a standard as to how long the average trade is held. From there, a shorter term time frame should be chosen and it should be at least one-fourth the intermediate period (for example, a 15-minute chart for the short-term time frame and 60-minute chart for the medium or intermediate time frame). Through the same calculation, the long-term time frame should be at least four times greater than the intermediate one (so, keeping with the previous example, the 240-minute, or four-hour, chart would round out the three time frequencies).
It is imperative to select the correct time frame when choosing the range of the three periods. Clearly, a long-term trader who holds positions for months will find little use for a 15-minute, 60-minute and 240-minute combination. At the same time, a day trader who holds positions for hours and rarely longer than a day would find little advantage in daily, weekly and monthly arrangements. This is not to say that the long-term trader would not benefit from keeping an eye on the 240-minute chart or the short-term trader from keeping a daily chart in the repertoire, but these should come at the extremes rather than anchoring the entire range.
Long-Term Time Frame
Equipped with the groundwork for describing multiple time frame analysis, it is now time to apply it to the forex market. With this method of studying charts, it is generally the best policy to start with the long-term time frame and work down to the more granular frequencies. By looking at the long-term time frame, the dominant trend is established. It is best to remember the most overused adage in trading for this frequency — The trend is your friend. (For more on this topic, read Trading Trend Or Range? )
Positions should not be executed on this wide angled chart, but the trades that are taken should be in the same direction as this frequency’s trend is heading. This doesn’t mean that trades can’t be taken against the larger trend, but that those that are will likely have a lower probability of success and the profit target should be smaller than if it was heading in the direction of the overall trend.
In the currency markets, when the long-term time frame has a daily, weekly or monthly periodicity, fundamentals tend to have a significant impact on direction. Therefore, a trader should monitor the major economic trends when following the general trend on this time frame. Whether the primary economic concern is current account deficits. consumer spending, business investment or any other number of influences, these developments should be monitored to better understand the direction in price action. At the same time, such dynamics tend to change infrequently, just as the trend in price on this time frame, so they need only be checked occasionally. (For related reading, see Fundamental Analysis For Traders .)
Another consideration for a higher time frame in this range is the interest rate. Partially a reflection of an economy’s health, the interest rate is a basic component in pricing exchange rates. Under most circumstances, capital will flow toward the currency with the higher rate in a pair as this equates to greater returns on investments.
Medium-Term Time Frame

Increasing the granularity of the same chart to the intermediate time frame, smaller moves within the broader trend become visible. This is the most versatile of the three frequencies because a sense of both the short-term and longer-term time frames can be obtained from this level. As we said above, the expected holding period for an average trade should define this anchor for the time frame range. In fact, this level should be the most frequently followed chart when planning a trade while the trade is on and as the position nears either its profit target or stop loss. (To learn more, check out Devising A Medium-Term Forex Trading System .)
Short-Term Time Frame
Finally, trades should be executed on the short-term time frame. As the smaller fluctuations in price action become clearer, a trader is better able to pick an attractive entry for a position whose direction has already been defined by the higher frequency charts.
Another consideration for this period is that fundamentals once again hold a heavy influence over price action in these charts, although in a very different way than they do for the higher time frame. Fundamental trends are no longer discernible when charts are below a four-hour frequency. Instead, the short-term time frame will respond with increased volatility to those indicators dubbed market moving. The more granular this lower time frame is, the bigger the reaction to economic indicators will seem. Often, these sharp moves last for a very short time and, as such, are sometimes described as noise. However, a trader will often avoid taking poor trades on these temporary imbalances as they monitor the progression of the other time frames. (Learn more about dealing with market noise, read Trading Without Noise .)
Another clear benefit from incorporating multiple time frames into analyzing trades is the ability to identify support and resistance readings as well as strong entry and exit levels. A trade’s chance of success improves when it is followed on a short-term chart because of the ability for a trader to avoid poor entry prices, ill-placed stops, and/or unreasonable targets.
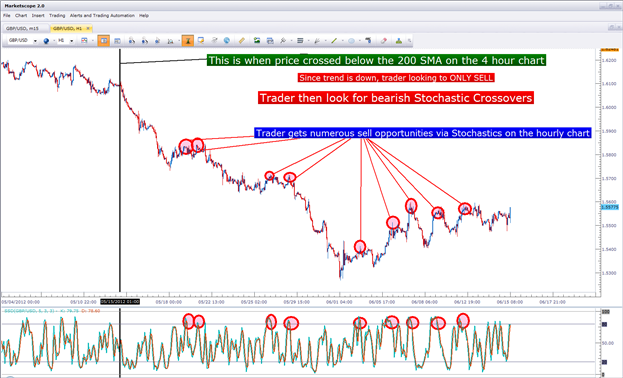
Example


