Trading Forex using the RSI Indicator
Post on: 21 Апрель, 2015 No Comment

One of the most popular indicators used by Forex traders is the RSI, or relative strength indicator. It is particularly favoured by intraday traders and scalpers. The indicator is a measure of price momentum – or to be more precise the relative strength of a security against itself.
How can somethings strength be measured against itself- that sounds illogical doesnt it?
Well it can, sort of, by distinguishing between its up-days and down-days and comparing the one set against the other. The RSI does just that, by comparing the average of up-day closes versus the average of down-day closes over a certain time-span, using the following formula:
RSI = 100 – 100/1 +RS
Where RS = average of x days up closes/average of x days down closes.
RSI is an oscillator which always gives a result between 0 and a 100. The default time-span is 14
but other favourite spans I have seen in use include 6 and 7 especially for shorter-term horizon traders.
Interpretation
RSI is mainly analysed for indications of overbought and oversold states in the underlying security. The oscillator is generally considered overbought when it rises above 70 and oversold when it falls below 30, however, these standard default settings can be altered at the discretion of the individual trader.
They also tend to require modification if the time span is altered substantially. For example if it is increased then the RSI tends to make shallower swings, so the bands need to be adjusted to perhaps 65 and 35 instead – wheras for a 7 period setting the opposite is true and the bands might require adjusting to 80 and 20 respectively.
When the indicator reaches overbought then it is telling the trader that it is unwise to open any new long positions, when it reaches the oversold level then no new shorts should be opened.
When the oscillator moves back down below the overbought zone after having been in it then that is a signal for the trader to open a short position. When it moves from oversold back above the line then likewise that is a signal to buy the security.
Other forms of Interprestation
Apart from the classic form of interpretation the RSI can also be analysed by comparing it to the price and looking for diverging and converging behaviour.
For example if the price of the security is setting new highs but the RSI is not confriming those highs then that is described as divergence and it is sometimes a sign that there will be a correction in the price.
On the other hand if the security is making fresh lows but RSI is not then that can warn of underlying strength and the possibility of a bullish reversal.
Chart Pattern
Another powerful way of using RSI to analyse market behaviour is to look for reversal patterns in the RSI such as double tops, triple tops and heads and shoulders.
Trending versus non-trending markets
The RSI indicator works best when the market is in a broadly sideways mode. This is because when the market is consolidating the signals the RSI gives by moving out of overbought or oversold tend to lead to larger corresponding price moves in the security.
On the other hand when the security is strongly trending the RSIs signals often result in very small price movements partiuclarly if signalling corrections against the prevailing trend.
For example if a security is in an uptrend and there is some temproary weakness and the overbought RSI falls below the 70 line it is a signal to sell, however, if the market is trending then it is often the case the drop in price accompanied by the sell signal will be insignificant before the rally resumes.
Traders who use the indicator intraday should read the research carried out at Daily FX which shows that the most favourable time of day for trading Forex using RSI is during Asian market hours. This is because at that time of day the Forex market does not trend as strongly. During the European and especially the U.S session on the other hand when more people are trading the market trends more strongly and researchers found RSI worked less profitably as a trading indicator.
Optimisation
Research carried out by Ned Davis Research has shown that RSI can be optimised by combining it with the stochastics indicator and only acting on signals generated when both indicators confirm moves out of oversold or overbought levels. In this way the basic model can be improved on, by combining with Stochastics.
Trading Ideas
RSI is a favoured tool of scalpers – that is very short term horizon traders who literally scalp the market of a few pips here and there. They often use it on 5 or 15 minute chart where they look for divergences and convergences with price and double bottom or top formations.
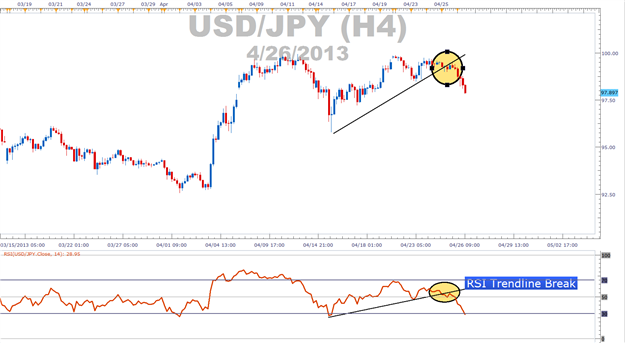
Intraday traders also often use RSI in conjunction with pivot points, moving averages and trend-line analysis to aid them in identifying possible market turning points.
Such simple strategies are often quite profitable is the trader can practice proper money management control and RSI is a classic indicator which continues to retain its accuracy and polularity years after it was developed.


