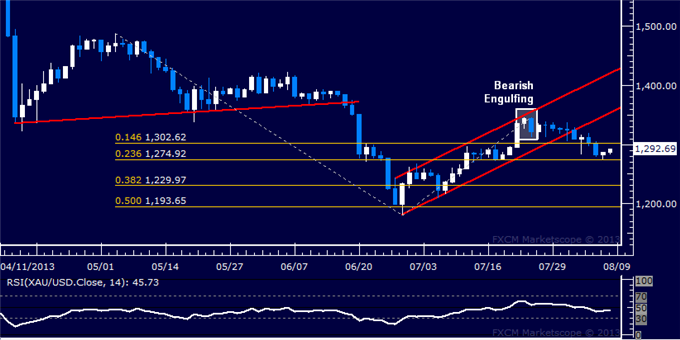
Trading Failed Breaks_2
Post on: 11 Август, 2015 No Comment

It is well known that many of the trading strategies for forex markets are based on trading breaks of key levels. These breaks occur whenever the price moves outside an established range, or simply breaks a key support or resistance level. The latest extremes in price are often the basis for support or resistance, and a violation of these levels is said to constitute a breakout. However, some traders maintain that breakouts are not reliable. There has been no conclusive proof that this is true, but any experienced trader knows that many breakouts failed. This has led to strategies for trading failed breaks.
Trading Failed Breaks
The traders who feel that breakouts are not reliable tend to believe that trading against these breaks is the right thing to do. Of course this is subject to as much debate as the strategy of trading the breaks in the first place. No matter if price is moving higher or lower, it can be very difficult to tell if it is going to continue moving in the same direction, unless you happen to have access to the order books. With the forex markets this is impossible, and even those who do have access to an order book will see just a fraction of all the currency orders currently out there. Some believe that the reason breaks fail so often is due to stop hunting at the key support and resistance levels, but this too in inconclusive. Regardless, many traders like trading failed breaks.
This is most clearly seen in any divergence strategies. These are created with the express purpose of locating and trading failed breaks. They occur when price breaks to a new high or low, but the indicator doesn’t follow suit, thus creating a divergence in price versus the indicator used. Naturally though, just trading failed breaks isn’t sufficient. One still needs to develop a plan for their entry, stop loss levels and exits. As with any approach in the markets, this can be as simple or as complex as one wants to make it. One of the most simple methods for identifying failed breaks is a reversal candlestick pattern such as a doji, hammer, shooting star or pin bar. When these occur at the right levels and proper location on a chart they can make trading failed breaks much easier.
All of these reversal candle formation have one thing in common. They all have a long wick or shadow in relation to the size of the candle body. They form as price breaks out, continues to move in the direction of the breakout, but then fails to gather enough momentum to maintain the new price level and drops back to prior levels. If the price remains above resistance of below support this could indicate a breakout. But when one of these candles occurs it indicates a reversal, or a failed breakout, and it is possible to trade the failed break.


