The Stochastics Indicator Explained for You for Stock Trading
Post on: 16 Март, 2015 No Comment

The Stochastics Indicator was developed by a fellow named George C. Lane in the 1950’s.
It is classified as a momentum oscillator indicator that shows the location of the current close relative to the high/low range over a set number of periods. It shows overbought and oversold readings.
Closing levels that are near the top of the range indicate buying pressure, or accumulation. and those near the bottom of the range indicate selling pressure, or distribution .
This indicator is plotted on two lines — the %D line and the %K line — with values ranging from 0 to 100.
There are 2 types of this indicator:
The fast line is simply %K and %D plotted on the same chart. It is subject to quicker moves and can catch more turning points, but is also subject to greater whipsaw or false movements.
The slow line is less sensitive. The %D of the fast line becomes the new %K, which is then smoothed once again using a three day moving average to obtain the new slow %D.
Ya I know, this is all pretty confusing. It doesn’t really matter what the math is behind its formula though, you just need to understand and know when to use it properly.
The slow line is preferred for filtering out market noise and is less prone to violent whipsaws.
For further in-depth information on the Stochastic Indicator, this resource contains critical information to help you learn to use stock charts and technical indicators in a clear, simple and concise manner to improve your trade entries and exits in the stock market.
Stochastics-Indicator Uses
_______________________________________________________________
The Stocastics-Indicator has two major uses:
- Overbought/Oversold
- Price Divergences
Overbought/Oversold
As mentioned above, the true value of an Oscillator indicator, is to determine when a stock has reached an overbought level, or an oversold level.
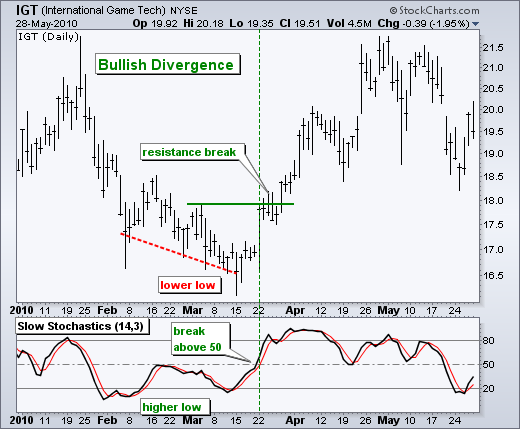
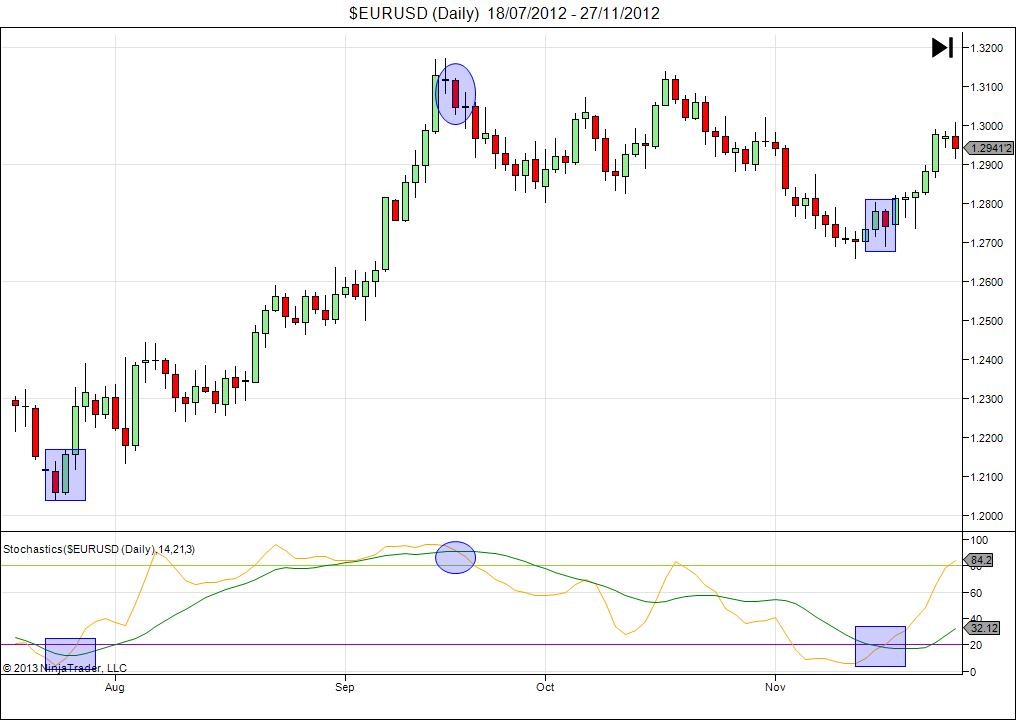
As shown on the chart above and on the bottom left hand side, the indicator is shown to be overbought at the 80 position, and oversold at the 20 position, on a scale of 1 — 100.
Price Divergences
The most significant and strongest signals given by the Stochastics-Indicator are generated on price divergences between the indicator and the price of the underlying stock.

Bull divergences give buy signals.
As shown in the chart above, a bullish divergence is shown when the price makes a double bottom in early March, and the indicator diverges and slants up.
The price then rallies up higher. It happens again in May.
In July, the price is sinking, while the indicator is diverging and staying flat. Sure enough, the price rallies and moves up to around $120.
Buy signals are especially strong if the first Stochastic-bottom is below its lower reference line (20 on left hand side), and its second bottom is above it.
Bearish divergences are the opposite. Double Top patterns work well with this indicator.
As with this indicator, it is meant to be used in conjunction with other indicators.
_______________________________________________________________
Technical Analysis 3:
Interpret Technical Indicators like a Pro!
Learn How to Truly Understand and Use Indicators For What They Were Designed For
The Technical Analysis Course:
Personalized Course on Technical Analysis Techniques !
Lays the Foundation for Investors to Become Expert Technical Analysts and Smarter, More Successful Traders.


