The 3 Step Retracement Strategy
Post on: 27 Июнь, 2015 No Comment

Talking Points:
- Retracements are pullbacks within a trend. Find the trend and resistance using trendlines. Entries can be planned using a Fibonacci retracement.
When it comes to trending markets, traders may consider trading a breakout or a retracement strategy. Today we will review using trendlines and Fibonacci retracements to trade pullbacks in price for trending markets.
Lets get started!
Find A Trendline
Before we can consider trading a pricing swing, we need to first be able to find market direction as well as support or resistance. This issue can be solved by creating a trendline. These areas can be found on a chart by either connecting to highs or lows, then extrapolating their direction on the chart. In a downtrend traders should look for price action to be declining under trend line resistance, while in uptrend prices should be advancing above trendline support.
Below we can see a trendline formed on the USDJPY Daily chart. As the highs for this currency pair has been declining 12 2014 we can connect these values to form a point of resistance on our graph. This line will act as our price ceiling, and as long as price remains under this value we can look to find new opportunities to sell the market. This line can be left on the chart, and will be used as we continue looking for a market retracement.
Learn Forex USDJPY Daily Trendline Resistance
(Created using FXCMs Marketscope 2.0 charts)
Fibonacci Retracements
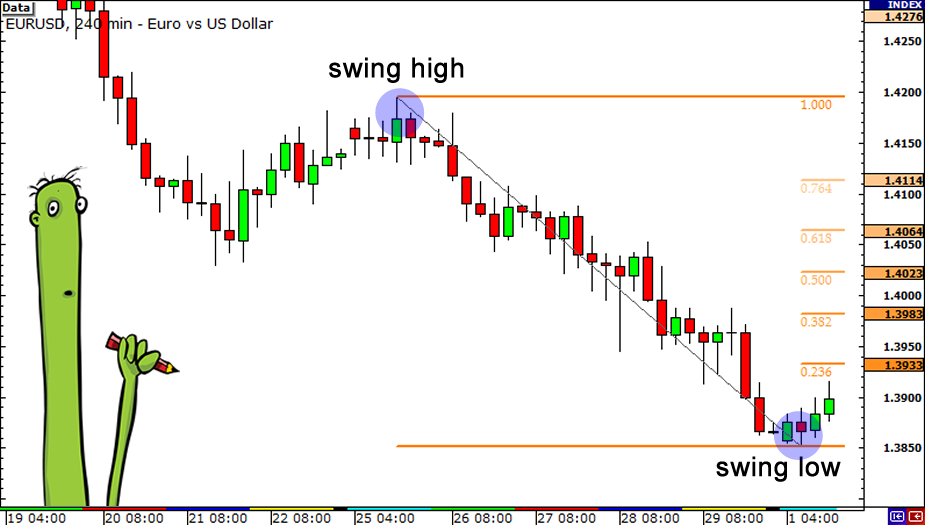
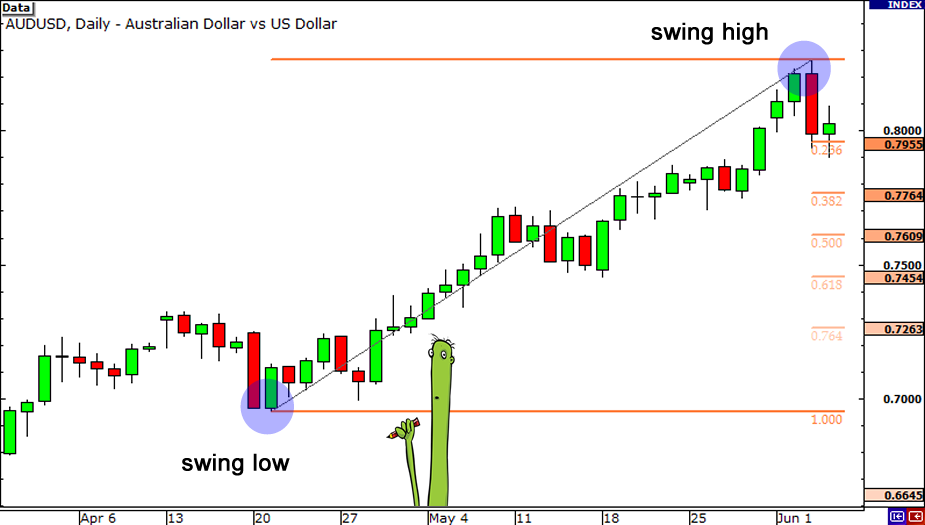
Once market direction and trendline resistance is identified, we need to identify an area to enter into the market. This can be done by finding a confluence of resistance using a Fibonacci retracement. These retracement values are displayed as a percentage of the previous move as measured from swing high/low in a downtrend. Much like our previously drawn trendline, these retracements can pinpoint areas where the market may turn. Traders should look to see where these two values converge and then plan to enter the market.
Below you will find the established trendline on the USDJPY. The Fibonacci retracement tool has been added, and traders should take notice where the 78.6% retracement value meets our trendline. In the event that price retraces to this point, they can then plan to enter the market and look for price to return toward lower lows. Traders may sell the USDJPY with this strategy using market orders or utilize a preset entry order.
Learn Forex USDJPY Trendline & 78.6% Retracement
(Created using FXCMs Marketscope 2.0 charts)
Exiting Positions
Now that we have a plan to enter the market on a price swing, traders will need to identify when it is time to exit the market. This is always the third and final step of any successful strategy! In order to manage risk, traders should first consider where to set a stop order. In a downtrend like the USDJPY daily chart, traders should consider placing this value above resistance. On the chart below stop orders have been placed outside of resistance, above our current trendline and previous swing high.

Lastly, we need to consider a take profit point. Traders should always look to use a risk/reward ratio to earn more profit on a successful trader, relative to a potential loss. This can be done by extrapolating a preset value relative to the stop value set above. Traders may also consider setting limit orders below the current swing low. In the event that our currency downtrend is to continue, by definition, price should continue moving towards lower lows down our graph.
Learn Forex USDJPY Stops & Limits
Check out these other 3 step trading strategies on DailyFX!
—Written by Walker England, Trading Instructor
To contact Walker, email WEngland@FXCM.com. Follow me on Twitter at @WEnglandFX.
To be added to Walkers e-mail distribution list, send an email with the subject line Distribution List to WEngland@FXCM.com.
Want to learn more about Moving Averages. Take this free 14 minute Moving Average course presented by DailyFX Education. In the course, you will learn how to filter worthwhile trends, identify support and resistance, and find which entries give you the highest probability trades.
Register HERE to start your FOREX learning now!
DailyFX provides forex news and technical analysis on the trends that influence the global currency markets.
Learn forex trading with a free practice account and trading charts from FXCM.


