The 1 Stock Market Cycle Secular Bear Market V Bull Market
Post on: 16 Март, 2015 No Comment

Pages
Secular Bear Market Vs. Cyclical Bull Market
The big argument on twitter, among many, is focused on whether we are in a bull market or a bear market. Both sides are equally vociferous and committed to their position. What they don’t realize is that they are both right in their own way. But understanding the difference in the way they are right is critical to successfully navigating the current market.
Marketwatch published the chart below showing the current market uptrend compared to the last market uptrend. The similarity is remarkable.
The 2009 to 2013 move up has displayed similar behavior to the 2002/3 to 2007 bear market rally (cyclical bull market), and based on the chart above you may well conclude that it hasn’t got much further to run.
But how can we determine whether 2009 to 2013 is a bear market rally or the beginning of a new secular bull market?
Barry Ritholtz’s blog discussed the top ten S&P 500 bull markets of 20% or more, see table below. The current bull run comes in at number 6 and the table shows that it could continue on much further, based on past experience.
However one thing that is not immediately obvious from the table above is this; of the ten bull markets, six of these have been cyclical bull markets within secular bear markets, only the first three have been during secular bull markets. So the chances are that this is also a cyclical bull market within a secular bear market.
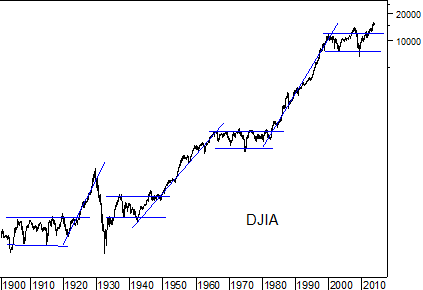
But hold on, the bulls cry, the markets are making new all-time highs, that’s bullish! Well not necessarily. During the bear market of 1965 to 1982 the Dow made new all-time highs in 1972 and then promptly fell 45%. So new highs are not necessarily an indication of a new bull market.
How do we know where we are in the current stock market cycle? Are we in the midst of a new long term stock bull market or a market rally within an ongoing bear market?
These are the questions that I set out to answer when I started to study historic stock market cycles. It comes as a surprise to most people to find out that booms and busts occur surprisingly regularly and that there is a repeating cycle in the stock markets.
My research has identified that a 17.6 year stock market exists within the markets consisting of downtrends lasting 2.2 years and uptrends lasting 4.4 years (2 x 2.2 years), with a combined cycle length of 17.6 years. I have called this cycle the Balenthiran Cycle and demonstrate how the intermediate turning points match stock market behavior going back to the early 1900s and extrapolate the cycle forwards to provide a market roadmap of the next secular bull market to 2035 and subsequent secular bear market to 2053.
Using the Balenthiran Cycle I forecast that we are in a secular bear market that will last from 2000 to 2018, and the current uptrend will end in 2013 and that we will have a low at the end of 2013 (not lower than the 2009 low). Following this low I forecast (using historic cycles) that we are likely to see a bounce in the markets with higher lows in 2015 and 2018 before the new secular bull market begins in 2018.
Bulls and bears can both therefore claim to be right, but it’s only by taking a historical viewpoint and looking at the bigger picture that investors can ensure that they position themselves correctly for the future.


