Technical Analysis Support and Resistance Basics
Post on: 10 Апрель, 2015 No Comment

An introduction to support and resistance basics. Support and resistance are technical analysis concepts which form the foundation for many trading strategies and other technical analysis methods.
Support Level Basics
Support levels are points where the price had a hard time pushing down through in the past. In other words, a support level is a level where a price stops falling. Often a support can be found at slightly different levels. For example, the price moves down to $90 in the morning, later in the day it goes down to $89.90 before moving higher, then near the end of the day the price touches $89.95 before moving back up to close at $91.
In this example 3 support levels are created, but together they form a support area. Support areas are more significant than a single level because it shows the market tried several times to breakthrough that region, but couldnt sustain it. In this case the support area would be $89.90 to $90.00.
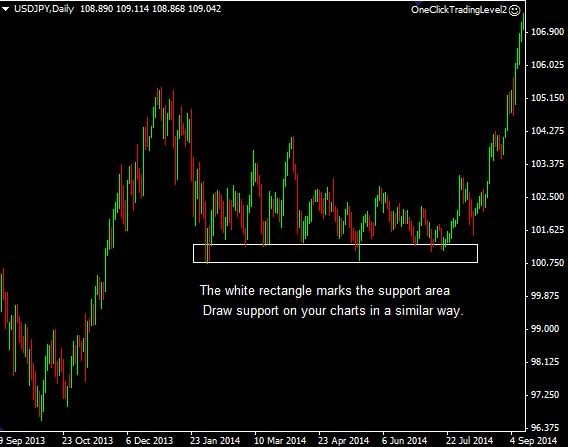
Figure 1 shows an example of a support area. Notice how the price moves to a similar area over and over again, and appears to bounce off it. This is support, because it shows buyers are willing to step in at that price area and push the price back up.
Figure 1. Support Area on USDJPY Daily Chart
Resistance Level Basics
Resistance levels mark areas where the price had a hard time pushing up through in the past. In other words, a resistance level is where a price stops rising. Resistance levels also form resistance areas. If a stock rises to $90 then declines, rises to $90.10 then declines, rises to $90.05 and declines, the trader knows $90 to $90.10 is providing resistance.
Figure 2. Resistance Area on AUDUSD Daily Chart
Resistance and Support Areas
Resistance and support levels are dynamic, meaning the price may edge past the old support resistance level, only to reverse course shortly after. This new price is a new resistance or support level, but should be coupled with old support and resistance levels in the same area to create a support or resistance area.
Support and Resistance Breakouts & False Breakouts
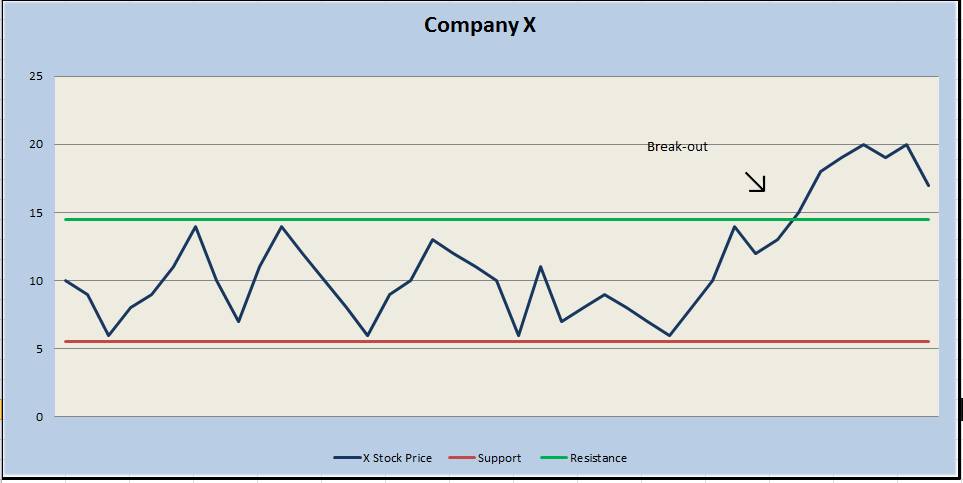
Support or resistance breakouts occur when the price moves through a support or resistance level/area. For instance, if a stock has moved up to $100 repeatedly, but cant break above that price, $100 is a resistance level. When the price finally moves above $100 its a breakout. When the price moves to a resistance or support level, but doesnt break through, its called a test (the level was tested ).
Figure 2 shows support and resistance area, followed by a breakout. The price breaks break strongly through support, and continues to move lower, showing that support for the stock (at that support level) is no longer there.
If the price moves quickly back the other way through the support/resistance zone it just broke out of, its called a false breakout . In the example above, if the stock moves above resistance at $100, thats a breakout, but if it falls back below $100 shortly after and proceeds lower, thats a false breakout. See Effective and Simple Forex Strategies for a strategy to capitalize false breakouts.
Strength of Support and Resistance
By using support and resistance areas (when available), instead of just a single level, we have a better chance of picking levels to watch that have more significance. The more times a price has been tested. but not moved through significantly, the more important and stronger that price area is. For example, if the price is in uptrend, reaches 1.20 and then declines, that is not particular important. If the price reaches 1.20 two or three times and cant get through that is significant. The reason is that during an uptrend we expect the price to make new highs, thus moving above old ones. During a downtrend we expect the price make new lows, thus moving below old ones. Usually the more times an area has been tested, with no significant breakout, the stronger the breakout when one eventually develops.
The strength of support or resistance can also be determined by the strength of the reaction off of it. Any area that reverses a trend can be considered strong. When the price comes back to test this area we can expect that some support/resistance will be provided in the vicinity of this reversal point. This doesnt mean the price will always stop at that level again, but the area should be given some respect by the trader.
Figure 3. Strong Resistance Created by a Reversal
Diagonal S&R (trendlines)
There is also diagonal support and resistance levels, which change over time. The lines, or areas, of support and resistance are called trendlines (See: How to Use Trendlines For Trading – Dispelling the Myths ). To create an uptrend trendline, connect the low points during an overall rise in price. To create a downtrend trendline. Trendlines show where traders are stepping in to stop the price from rising or falling. The actual support/resistance levels associated with a trendline are always changing since the trendline is sloped.

Figure 3. AUD/USD Hourly Chart
Support and Resistance Final Word
Support and resistance occur on all time frames. These levels can be seen on a one minute chart which may only show one day of activity, or a weekly chart which shows years worth of data. If multiple time frames show resistance at a certain level, that level is likely very significant, for all traders. Even a day trader can benefit if a breakout occurs on a weekly chart. A longer term trader may not be aware of why a major move occurred intra-day, but it could be because strong support or resistance levels were broken on the the short-term chart.
Not all time frames need to be analyzed, but it is a good idea for all traders to look at time frames longer than the one they currently trade on to be aware of larger forces that may be at work. If longer term traders are looking to enter or exit, and want a good price, it may be worth looking at shorter time frame charts.
Over 300 pages, forex basics to get you started, 20+ forex trading strategies, how to create your trading plan for success.
You May Also Like:
Focus on ‘Middle Waves’ for High Probability Trades A trend unfolds in stages, with the middle stage typically being easy to spot and the most lucrative. Here’s how to trade it. The entry technique and trade setup applies to other waves as well, not just the middle wave(s). For more examples and another way of “looking at it” see ABC Forex Trading Strategy – Video (can be used in other markets)–the trade trigger is quite similar except we are looking at the market and setups in a slightly different way, which may appeal to certain traders.
Elliott Wave Basics: Trading Impulsive and Corrective Waves Even if you never delve further into Elliott Wave theory, the concept of impulsive and corrective waves will greatly aid your trading. These two types of waves create the overall market structure, and therefore being able to tell the difference between them is the difference between taking high probability trades or low probability trades.
A Four-Chart Lesson in Spotting Trade Setups Find low-risk, high-confidence trading opportunities by trading with the trend. The trick is to find the end of market corrections…
How to Channel Impulse Waves on a Price Chart – Parallel lines are a simple but effective tool. Here’s how to use them to form price projections different stages of a trend.


