Support and Resistance for Trade Entries and Exits
Post on: 24 Июнь, 2015 No Comment

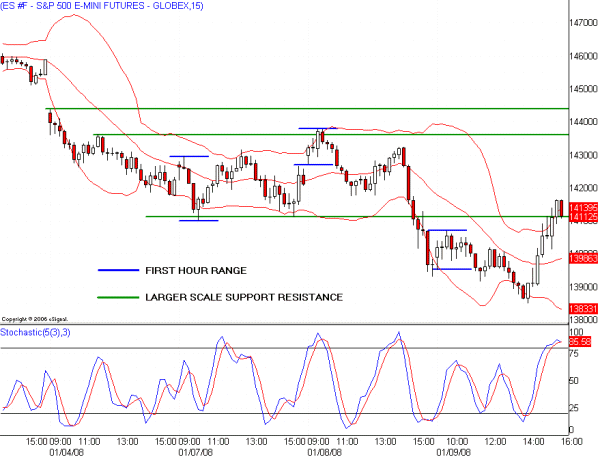
Support and resistance levels are key levels where it is possible for the price of a currency pair to experience reversals. As such, they should always be considered whenever a trader wished to make trade entries and exits.
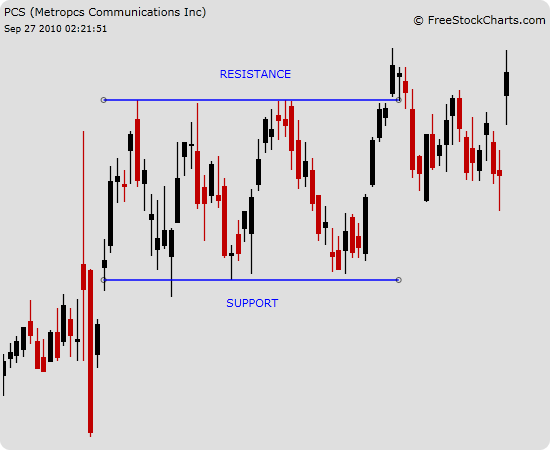
A price support is a target price at which falling prices may stall or reverse upwards. Usually, the price of the currency asset will attempt to break through this level and will test it several times, each time being rebuffed. The more the support is tested without a break, the stronger the support. A horizontal line drawn across this price target will form a price support.
A resistance level is a price level at which rising prices either stall or retreat from. The more that price level is tested and rebuffed, the stronger the resistance. A line drawn across this level will form a resistance line.
At times, prices can break through these support and resistance levels, only to find it difficult to break other levels in its advance. In this case, the previous support line now constitutes a resistance and the previous resistance line will now constitute a support.
Support and Resistance Lines
In forex, the concept of pivot points was developed in order to predict the price levels that form the various points of support and resistance in the market. Pivot points can be calculated manually or automatically using pivot point calculators. These pivot point calculators are freely available online. Use the search phrase “automatic pivot point calculator” on Google, download the software into the “experts” “indicators” folder of your MT4 client, then load your trading platform and pick the indicator from the “Custom Indicators” folder and attach to your charts.
The pivot points are shown in red (R1, R2, R3), green (S1, S2, S3) and purple (central pivot point).
Trade Entries and Exits
The bias for support and resistance trading is to sell at the resistance lines and buy at the support lines. The central pivot is neutral; it can serve as a support or resistance depending on the trade direction.
A trader will therefore be looking for the following:
Selling points:
- At the central pivot point when price moves up from S1
- At R1 when price moves from the central pivot point
- At R2 when price comes from R1
- At R3 when price comes from R2

Buying points:
- At the central pivot point when price moves down from R1
- At S1 when price moves down from the central pivot point
- At S2 when price comes from S1
- At S3 when price comes from S2
In order to sell from R1, R2 or R3, the price of the currency asset must have broken upwards from the central pivot, R1 and R2 respectively. The candle of the move has to close above each of the respective pivot levels to constitute a true break. If the candle in question does not close above the pivot level, the move will only test that pivot level and reverse. This will constitute a sell signal. So traders should only sell from resistance levels that have not been broken, and use the pivot level below it as an exit point. So if for instance price broke above R1 and did not close above R2 but only tested it, the trader should go short at the open of the next candle at R2 or slightly below it and use R1 as the exit point.
In the same vein, buying at S1, S2 or S3 will require that the asset has broken downwards from the central pivot, S1 and S2 respectively. If the candle in question does not close below the pivot level, the move will only test that pivot level and undergo a bounce. This will constitute a buy signal. So traders should only but at an unbroken support level and use the pivot level above it as an exit point. So if for instance price broke below the central pivot and S1 without closing below S2 but only tested it, the trader should go long at the open of the next candle at S2 or slightly above it and use S1 as the first exit point. If the reversal is strong enough and closes above S1, then the central pivot should be used as the next exit point.
This chart illustrates what has just been explained above.
The reference candle is the hammer at the central pivot.
- Price went above and closed above R1, thus converting R1 to a support (point A)
- The subsequent candles retraced and bounced off R1, strengthening its new status as a support
- Price broke above R2 (point B) and slightly above R3 (point C) before reversing below R3
- Price then retraced upwards and reversed fully at R3, confirming it as a strong resistance level (point D)
- Retreating prices then tested R2 several times (point E), eventually broke through R2 downwards and also broke R1 (point F).
- Price then tested central pivot without breaking it, conferring a support status to the central pivot (point G)
- Upswing in price broke through R1 upwards (point H) and stalled very close to R2 (point I)
- Failing to break R2, price reversed downwards from R2, broke through R1 again (point J), broke central pivot as well (point K) and S1 (point L).
The trader can then use our principles to define entries and exits according to the above article.


