Support and Resistance_1
Post on: 17 Июль, 2015 No Comment

News & Blogs Menu
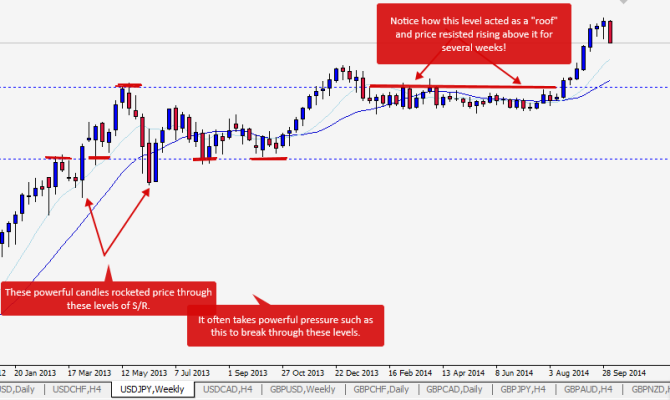
Support and Resistance is the cornerstone of most Technical Analysis based Daytrading Strategies.
You see whether you trade Forex, Stocks, Commodity Futures or even Options, Support and Resistance is always there. lurking in the background, Hidden on your chart, LIKE IT OR NOT.
Click on image to enlarge!
Support and Resistance will provide you with what we at Breakaway Trader refer to as “Catch Zones” Catch Zones are areas where we have the best chance of Catching a good move in the focus market either up or down wherein we seek to capitalize and thereby add $$$$ to our trading accounts. Afterall, that’s what we are here for. Right?
It is important to come to a point of not only believing that these areas exist, but also HOW to find them and then HOW to use them in order to Monetize this knowledge and develop a Trading Strategy that you can implement and execute OVER and OVER AGAIN. Remember, “Repetition is the mother of skill” and believe it or not it does require skill to trade off of support and resistance effectively, because we all know that not all support and resistance will end up reversing a market.
In fact you can be guaranteed that fact and use this knowledge to add additional strategic layers to your trading plan. I would go so far to say that you need to add this layer and not doing so will ultimately cost you in either losses or missed opportunities.
The catch is that there are numerous ways that a trader can determine where there are areas of support and resistance and trying to determine which method is going to be the right one is really a waste of time. The answer is they are all partially right, but some are more consistent and accurate than others.
Simply knowing how to flip on an indicator and locate Daily Pivots based on Camarilla or the Floor Trader formula for example will often yield levels that offer average results and lack luster consistency. Locating pivots from historical swing sets can be very effective as well, but it is certainly not something that will provide consistent entry spots all on it’s own if they did then the market would never extend beyond it’s historical pivot highs and lows.
Fibonacci Clusters and Volume Profile areas are perhaps the most powerful methods that the professional trading community has at it’s disposal for locating the most consistent and highest probability Support and Resistance Areas on the chart because they offer areas that are beyond recent or historical pivot areas and are much more PREDICTIVE in nature. Unfortunately, these are two disciplines that do require a significant investment of your time and money to learn and you don’t want to place real money trades on the line using these techniques until you know, that you know, that you know you have it right.
Catch Zones
Once you do have a good working knowledge of how to perform this analysis you can Pile all of these methods on top of one another and look for areas on your chart where they all agree, then you have what we call CONFLUENCE..or AGREEMENT or there is a CONSENSUS of methodologies all pointing to the same areas that you should be considering an entry into the market. All of a sudden your support and resistance levels take on a whole new meaning because now you can focus less on trying to figure out where the market may or may not turn and place more brain power into waiting to identify a setup and an eventual “trigger” once the price has reached these critical areas of Support and Resistance Confluence or again moved into a “CATCH ZONE”.
We have several proprietary tools at Breakaway Trader that will do most of the heavy lifting when it comes to compiling the various calculation results that are needed in order to provide these areas for you with the push of a button. We call it “The Easy Button”.
You see Support and Resistance can be very much like a gas station along the highway. Price can go to the station and get what at needs then turn around and go home or beyond, or it can pass right through if it got enough fuel at the previous stop. One or the other is going to happen. This is not something you have to think about.
It will happen. What you need to be thinking about is what will you do when price gets to the gas station. This is why you need to add the next strategic layer to your Daytrading Strategy and it brings me to what we refer to as “Trade Triggers”.
To be crystal clear…….identifying Support and Resistance is only the first component of a successful daytrading strategy, but when price does trade into the Catch Zone we need to then begin to “Read the Music” that the market is playing. The Catch Zones are the areas where we want to develop skills that will allow us to quickly determine if we believe that price has a more likely probability of going back in the direction it came from or continuing on to the next gas station or support/resistance area. One of the elements you will need to have in your bag of trading tools is two or three good Trade Triggers.
WHY Multiple Trade Triggers?
Many traders have found that it is best to use multiple triggers for the same reason that it makes sense to use multiple methods of determining Support and Resistance Levels. If one doesn’t fire then another one will. if more than one do at the same time and place then it makes sense that the triggered area is more likely to be followed by a trade worthy move in one direction or the other. You can almost think of using multiple triggers as using a shotgun to hunt ducks instead of a rifle. Lot’s of pellets flying in the same area providing an much increased chance of hitting the target over a single slug being launched at a moving target. Duck hunting with a rifle makes very little sense and trading with one trigger is just about as effective.
So let’s take inventory of where we are right now..

We know that Support and Resistance exists and these are the areas where the market is going to turn around and go the other direction sooner or later. We know that when the price gets to these areas of S&R that we refer to as Catch Zones, that we are going to need to see a setup and a trigger. The last element that many successful traders add to the trading process is Filtering. so let’s briefly discuss what this means.
What is Filtering?
Filtering can actually come in multiple forms as well. but here are the main conditions that should be screened or considered before entering a trade at support or resistance or once that support or resistance has been achieved.
1. Overbought or Oversold Conditions – Is the market extended and visiting an area where we would expect to see exhaustion or is it not? Clearly if there is a setup and a trigger in a catch zone but the move is in its infant stages of development then this catch zone has a high probability of NOT turning the price around but instead being one of those gas stations where price simply fills up and moves to the next station or perhaps is still running on enough fuel from the last station it visited.
2. Trend – What is the direction of the higher time frame trend? are you trading on a tick chart trying to get short when in fact the monthly, weekly, daily and hourly trend are all UP UP UP? that would be somewhat foolish, but many traders do this because they simply do not have proper filters in place when considering whether or not to enter a trade.
3. Strength or Momentum — Successful Daytraders do not enter trades very many times if there is no momentum behind a move. It is helpful to have a filtering mechanism that will provide insight as to whether or not there is momentum behind what appears to be a high probability trade setup.
4. 3 Dimensional Viewing of the elements listed above – The markets ARE 3D. Think about it, Markets are made up of people and personalities and of course algorithms as we all know in this day and age. but algorithms are developed to respond to and interact with the decisions of PEOPLE… People have many sides in some cases but let’s say that to keep it simple for the sake of this article, the people have three sides. AGAIN SIMPLE. Front, Profile and Back. If you were to see someone you know walking down the street from a profile view and you decide to approach and greet that person only to find upon doing so, that they are distraught over the loss of a pet or a loved one, you might wish you had not bothered them or approached them at that particular time. IF you could have seen their face or had the front view as opposed to only the profile view, then perhaps you would have had the information you needed to know not to approach…
The market is the same way, it has more than one side to it and for this reason successful traders know that they need to have a filter that can allow them to view the market from all of these sides which are TIME,PRICE and VOLUME. Trade Setups that are Triggered in Catch Zones or Support and Resistance Areas should be filtered from all three sides in order to have a high probability of success upon entering.
At Breakaway Trader we use our own proprietary Indicators and a handful of our favorite outside tools such as Fib Point, MT Predictor and Market Profile, to bring all of this together when considering an entry into a trade.
To learn more from Jeep and to review his trading journal featuring execution details and charts for each trade, visit BreakawayTrader.com .


