Stochastics Indicator Explained
Post on: 18 Июнь, 2015 No Comment

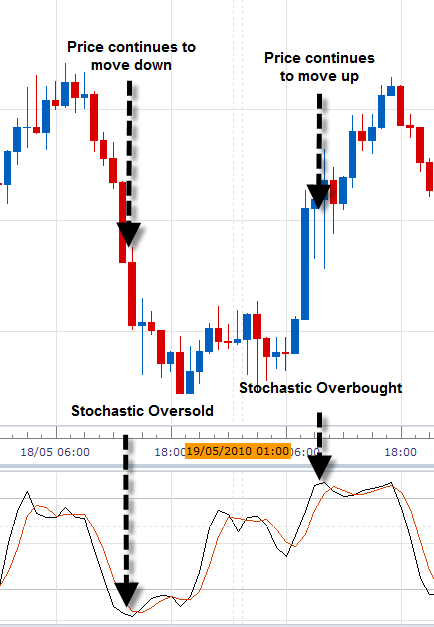
Stochastics have long been used in technical analysis. It is an old but reliable technical indicator. Gives a lot of Forex information and can be used in formulating a forex strategy.
Starting point of this indicator is that the closing price for each period in an uptrend is close to the high (because the bulls continue to increase the price) while the opposite happens in a downtrend (where the bears continue to sell). This is both simple and logical. The formula that the Stochastics indicator used then let see how far advanced the uptrend probably is. Sign up with our forex and binary options forum and receive our FREE eBook explaining the most used indicators.
Stochastics is a Range Trading Tool
Stochastics is ideally a range trading tool. As previously written Forex prices move 70 to 80% of the time in a range bound confirmation. In leisurely pace they go up and down, without that there is already too much going. For the real trend trader, these are not the most exciting moments, but to those who use and know ho to do it, this can be a gold mine. Great advantage of range trading is that the certainty of direction is quite large. You can stop/loss so pretty tight while the chance of success is high.
If the price moves in a range of only 25 pips, and you are 80% of the time on the right side this means that you (with stops of 25 pips) gain a profit of 200 pips and loses only 50 pips.
Well, Stochastics can help you determine where exactly in the range the rate moves. As with all technical indicators you should never blindly trust but youd rather use the tool as a guide.
Stochastics explained
The basics of stochastics is to measure the level of a moving average over 14 periods (usually). There is a fast stochastics and slow stochastics.
The fast stochastics measures the price compared to the 14 period moving average and gives them on a scale of 1 to 100.
The slow stochastics is the 3 period average of fast stochastics. This filters out the noise of the market even more so; a disadvantage is that he thereby also more lag.
Stochastics moves so on a scale of 1 to 100. This simply means that the stochastics display where the price figure is, compared to the 14 period moving average. When the figure Is 50, then the price is exactly in the middle of the 14 period moving average.


