Stochastics For Forex Traders!
Post on: 26 Июнь, 2015 No Comment

Learn this powerful Fibonacci Retracement method FREE that pulls 500+ pips per trade. Try these Forex Signals from two top gun traders. Download this 1 Minute Forex Trading System FREE. Stochastics is one of the most popular indicators in forex trading. You can find it on almost all platforms and charting services. But most traders use them incorrectly. Stochastics is an oscillator that has two components %K and %D. This is the formula to calculate K=100(C-L)(H-L) where C is the Close, H High and L the Low of the period. Typically this period is 14 days. However, 9 days period is also popular. %K is the 3 day MA of K and %D is the 3 day MA of %K.
%img src=http://media.avapartner.com/banners/p369485172.gif?tag=33247&tag2=
banner_6673 /%
Fortunately, you dont have to go into all this maths unless you want to fiddle with it and see if you can make it work better. One common question is how many days to use in Stochastics. Stick with 14 days as it is the default. Longer period means lesser signals and lower whipsaw while shorter periods means more signals and more whipsaw.
Stochastics is the measure of the close as related to the high and the low. It calculates the percent distance of the close to the range. Stochastics is often used as an overbought and oversold indicator. Typically when the Stochastics moves above 80, the market is overbought and when it moves below 20, the market is oversold. But, selling when it is above 80 and buying when it is below 20 is a money losing strategy.
This is due to the fact that the overbought and the oversold condition only works during a sideways market or a mildly trending market but it falls apart completely when the market is in a strong trend. Due to this fact, many traders only buy when the stochastics get above 80 and the %K crosses down below the %D and sell when the stochastics get below 20 and the %K crosses above the %D. Whatever, there is a better way to trade using Stochastics.
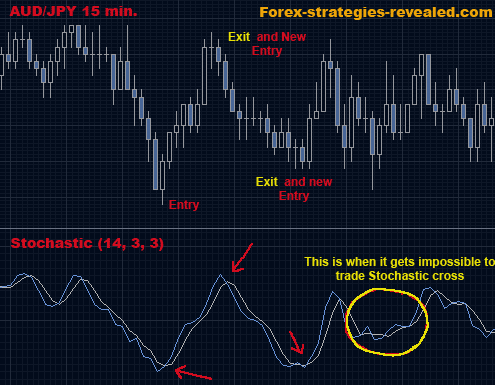
This strategy involves trading the %D and %K crossovers. %D is the slower moving line while the %K is the faster moving line. The best signals come when these crossovers happen when the stochastics is above the 80 line or below the 20 line.
When the %K crosses %D when it is still climbing, it is called Left Handed Crossover. The Right Handed Crossover occurs when %K crosses from the right side of the hump of %D. A right handed crossover will only occur when the market stabilizes first and then starts to drop. Many traders consider the right handed crossover as the more accurate signal.
Divergence Trading Using Stochastics:
One of the most popular ways to use Stochastics is divergences. A divergence takes place when the price and the stochastics diverge from following the same path. For example, if the price makes a new low but the stochastics dont, it is a divergence. In the same way, if the stochastics make a new high and the price doesnt, it is again a divergence.
Now, keep this in mind that divergence on a daily chart is quite different than the divergence on the weekly chart. Divergence on the daily chart means that the price will make a short term counter trend move in the next one to five days.

Whereas a divergence on the weekly chart means that an intermediate trend change is about to happen. What this means is that if there is a weekly divergence, the counter trend move will be quite strong as compared to the divergence on the daily chart. So, divergence on the weekly chart is a stronger signal as compared to that on the daily chart.
Divergences do predict trend changes but it is important for you to realize that you cant simply buy or sell when the divergence takes place as the change does not happen instantly after the divergence. It can take sometimes for the trend change to happen. However, these divergence on the daily and the weekly charts can be traded very profitably if you know when to enter and exit.
A failure occurs when the %K line changes direction but doesnt cross the %D and reverses back to the original direction. If this happens, you should interpret it as a signal that the original trend will continue and you should continue in that direction.
Now suppose, you dont have any position in the market. You spot a stochastics divergence appearing on the weekly charts. As said before, divergences appearing on the weekly charts are far more powerful than those appearing on the daily charts. Except a major retracement happening in the market soon. Look for entering into the market in the direction that the divergence is predicting.
In case you are long or short and you spot a divergence appearing simply exit the market on the first best opportunity like the appearance of the reversal bar pattern etc! Whatever, stochastics is an interesting technique. Learn how to use them properly and profitably.
Suppose, you are in a trade when you spot a divergence appearing on the Stochastics. Take profit for now by exiting half of the position. Now, if the stochastics divergence works, use the upside crossover to trigger a reentry buy order.


