Simple moving average
Post on: 16 Март, 2015 No Comment

Simple Moving averages, are you getting the most out of yours?
The simple moving average is without question. one the oldest and most basic tools used in technical analysis. Today we see simple, weighted, adaptive, and exponential moving averages employed by chart technicians. Because of the age of this tool though, does this mean it is also outdated or no longer useful? The answer is yes and no! To provide a more helpful answer though, we will divide our discussion into three parts.
In this issue, we will discuss an important difference in the evolution of the moving average and which type of moving average can benefit us most when it comes to reading stock chart patterns. Our next issue will discuss some basic uses for the moving average, and our last article in this series will discuss how to determine an effective length for your moving average along with some examples of how entry and exit signals can be developed from them. So here we go.
In the beginning. the simple moving average was the first to be used. If you stop and ask yourself why, you will see the answer is quite simple, no pun intended. The simple moving average for stock charting was developed during the pre-computer era. So a simple calculation like, data range divided by the number of entries was essential. This calculation had to be simple since it was going to be done with pencil and paper, or at best a calculator.
Can you imagine calculating an adaptive moving average by hand? Here is an example of the formula used by the charting software I use to build an adaptive moving average;
fast = 2/(2+1);
slow = 2/(30+1);
dir=abs(close-ref(close,-10));
vol=sum(abs(close-ref(close,-1)),10);
ER=dir/vol;
sc =( ER*(fast-slow)+slow)^2; graph0 = ama ( close, sc );

How would you like to being doing that by hand everyday? So this was just not practical, especially when compared to the calculation method of a simple moving average. So compared to not having a moving average at all, the simple moving average was a great advantage for chart technicians.
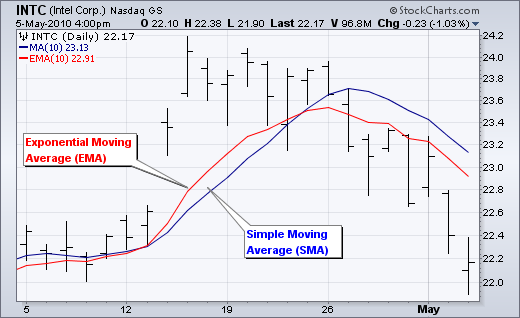
The short fall of the simple moving average can be demonstrated very easily. Note the chart below. The red line is a simple moving average and the blue line is an exponential moving average, both are 10 day averages of the closing price.
Notice that whether the stock is moving up or down the exponential moving average (blue line) is always one step ahead of the simple moving average. Would you also not agree that the blue line more accurately follows the trend? Why is this? Because of the way the moving averages are calculated. The simple average just adds up the 10 closing prices and divides by 10 to plot its place each day. The exponential average on the other hand, adds something new to this calculation. Without going into detail on how the calculation is performed, the result is that more weight or importance is place on the more current closing prices, the idea being that the newer figures are more relevant than the older ones. Obviously from the example above, this idea is right.
So what would a simple moving average be good for? I don’t know, maybe to chart a graph of how much you spent on groceries last year. For something more important though, like analyzing stock charts, I would much rather use an exponential moving average.
So now we know which kind of moving average to use. What is the proper length for a moving average? What can it tell us? How can we derive entry and exit signals from it? These issues will be covered in our next two articles. If this information was helpful to you and you are not currently subscribed to our newsletter and you like to learn about other profitable trading tips and resources, simply enter your name and email address below and we’ll be glad to share them with you.


