Simple Breakout Strategy in Forex Pop n Stop Trades
Post on: 6 Апрель, 2015 No Comment

How to trade the breakout in forex Part 1: Upside Breakout
Weve all been in the situation where we are watching price trade in a tight range. waiting to trade the breakout from that range. Our reasoning – perfectly logical – is that since price usually breaks out of a tight range with a violent move in one direction or the other, we could make a stack of money by getting on board that move early.
Most of the time, what happens in this situation is price gets away from us: even as we watch, it bursts through the range perimeter and heads off like a sky rocket (or falling rock if its going down). We look at all the pips mounting up and think Ive missed a great move again!
After that, the temptation to trade the breakout changes into a temptation to chase price, with usually disastrous consequences. We jump into the trade once it is underway and watch as the move begins to slowly stall and then reverse, taking us out for a loss.
The urge to trade breakouts is natural enough. We all want to hit the ball out of the park every once in awhile. But for most traders, most of the time it simply doesnt work. The following strategy is a suggestion for those who want to try trading breakouts. It attempts to build safety into the trade by combining price action with the Rejection Bar Candlestick pattern.
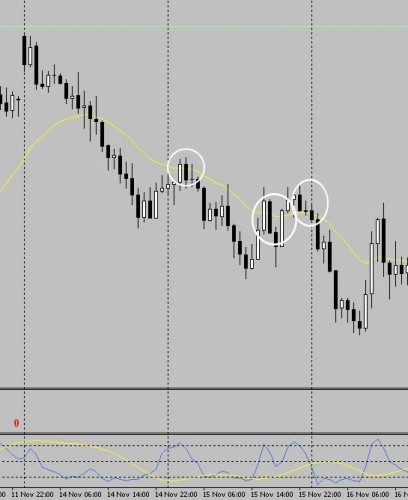
The image at the right above shows price breaking out of a range at the beginning of a trading session (the blue area beginning near the left of the screen). We may have no way of knowing what caused price to break to the upside. Perhaps it was a news announcement, perhaps it was simply a collection of large players moving into long positions. Whatever the cause, price popped out of the range and then temporarily stopped before resuming its upward move. This is why it is referred to as a Pop n Stop Trade. The area is indicated by the first white circle.
At this point, we see two bullish rejection bars forming above and rejecting from a round number (grey dotted line). Usually, when price bursts out in one direction with a long, fast candle like this, we can expect some retracement back to the point where price exited the range. This is simply because the fast move has covered an area of sparse orders. which now present as gaps in the market. These gaps usually fill at some stage, and usually sooner rather than later.
To cover the reasons we would have entered this trade:
- Time of day. price had been quiet leading up to the start of the session where we would normally expect liquidity and therefore volatility to pick up
- Price was trading in a tight range
- Price moved strongly in a pop and stop fashion. At this point it could go either way, so we watch for further signals
- Price then forms a fairly convincing rejection bar from a significant level – the round number. A further rejection bar follows.

One way to trade the move from here would have been to place your limit order 1 to 2 pips ahead of the rejection bars. Your stop loss could have gone just below the tail of the rejection bars, if you wanted to trade it aggressively, or for a more conservative approach you could have placed it just below the highs of the range.
Just as a note of interest I have circled a second area to the right where another possible trade entry set up. Once more a bullish rejection bar formed from a significant level – the confluence of a monthly pivot (dashed line) with the top of the Pop n Stop move to the left.
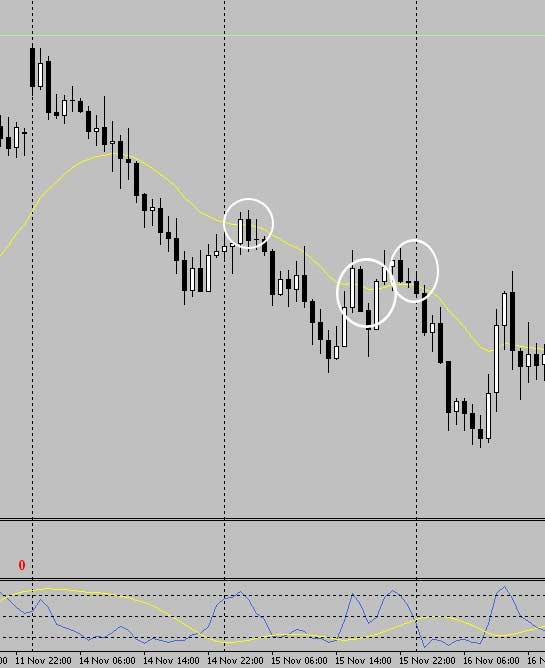
The second chart at the left the shows two possible trades. The first is a bullish rejection from a round number, the polarity indicator (the yellow stream) and an old range which is barely visible at the left of the screen. Price had earlier popped above this range and begun to form another range based just above it, much like one brick on top of another.
The second circle shows a very bullish candle with the first indications that price is beginning to stall: a substantial wick at the top. The second circled candle, a bearish one, completes a bearish Harami Candlestick pattern. If you had entered long at the first signal, this would be the sign to take profit, exit the trade or at least move your stop up.
The final confirmation of an impending move down is the bearish rejection bar whose extremely long wick rejects from the highs.
The Pop n Stop is an interesting strategy for those tempted to trade breakouts. Some of the things to be aware of in trading it are:
- It is a comparatively risky strategy as you are counting on the gap left by the sharp move not being filled. The counter to this risk of course, is the use of rejection candlestick bars to confirm the move.
- The pop and stop is best traded in the direction of sentiment after news has caused a breakout from a tight trading range
- It should always be traded in a highly liquid session to ensure there is enough support for the move to continue
- Beware of upcoming news announcements which can quickly reverse the sentiment and fill the gap
- Breakouts that enable this strategy often occur at the open of forex market sessions: New York and London are prime examples. In fact, I created this strategy based on research I had been doing on the London open breakout strategy I had seen discussed elsewhere. I have also seen talk about New York open breakout strategies, but the same rules can easily be applied. Suffice to say that opens are generally the best timeframe for breakout trading.
- Variations on the strategy often occur at the end of such sessions, but that is a topic for another post.
- This is a short term, scalping breakout strategy. Always set tight stops, and take profits quickly: 1.5:1 or 2:1 is generally the limit of your take profit that can be safely set. Price rarely flies to the moon after it pops. Dont be greedy!
- As indicated by the second white circle in both charts above, the strategy can be traded in conjunction with a countermove strategy if price reverses savagely and fills the gap.
As always, watch your risk and trade attentively. Enjoy!


