Shift Theory The Best Trading Indicator period!
Post on: 16 Март, 2015 No Comment

Shift Theory™ is a new category or class of technical analysis. The Shift Theory™ approach is a logical way of analyzing how price change should be measured on charts. What it does is it takes all of a data that is provided by a bar chart and breaks it down into three measurements or Shifts Theory Ratios™ :
- Upper Shift Ratio™ Measures Up Trend Strength
- Lower Shift Ratio™ Measures Down Trend Strength
- Inside Shift Ratio™ Measures Sideways or Choppy Markets
Shift Theory Ratios™ are very simple and yet so obvious that for decades the best and brightest with PhD’s working for the most powerful banks, brokerage firms and hedge funds using their skills in mathematics and statistics have not been able to figure it out. Shift Theory™ it is almost too good to be true until you look at the data and understand the fundamental reasons why it works . The ratios used to measure trend and direction are based on:
- Statistical Analysis
- Mathematical Facts
- Human Behavior

Benefits of Using Shift Theory Ratios™
As the creator of the Shift Theory Ratios™ I strongly believe this is the future of technical analysis because it is more than just an indicator. It is a logical approach to measuring price changes on charts. Most indicators and trading styles will never work because they have serious flaws in the way they are designed . Shift on the other hand works on:
Most new, experienced, automated and professional traders struggle because identifying trend is very difficult to do. The reality for most traders is that they lose mostly in choppy or sideways markets. The Inside Shift Ratio™ clearly and accurately identifies choppy markets. No other indicators work this well and that is the key to successful trading. If you can identify the trend, then it is easy to know what type of strategy to use in those market conditions. Shift Theory Ratios™ give a clear and easy to understand trend measurements on a scale of 0 to 100 plus exact buy and sell signals . Knowing the current trend can help the following:
- New traders that need a strategy to guide them and a the ability to know when to trade.
- Experienced traders who want to increase their profitability and lower their risk.
- Trading system developers that have a strategy that works but can’t seem to identify the trend or want a strategy to work with that already back tests well.
What separates Shift Theory Ratios™ is that Shift™ does not use the closing price. The closing price is always changing and creates a lot of noise that makes any type of technical analysis unreliable. Shift Theory Ratios™ rely on undeniable mathematical facts such as:
- Prices cannot move higher without making a high.
- Prices cannot go lower without making a low.
- Sideways markets have a high percentage of bars overlapping each other.
All of these can be measured with many indicators but what they fail to calculate is the ATR or Average True Range of a chart. The ATR is the natural range of a bar and that is the measurement of human buying and selling activity that naturally occurs in a single bar. Shift Theory Ratios fix that problem and that is why signals are accurate and don’t change much unless it is out of the normal range.
The Best Indicator Period!
Want proof that this is the best indicator period!
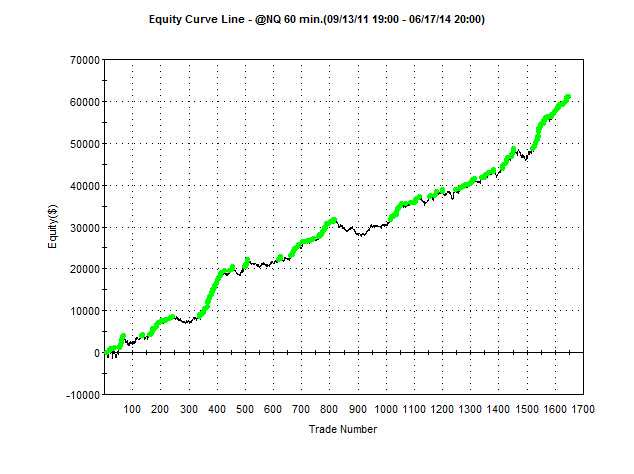
This test was done using a simple cross over strategy on the continuous NQ (NASDAQ E-Mini contract) on 2.5 years of tick data (that is the most I could get) looking inside of the bar on a 60 minute chart. The results on that time frame is over a 50% win ratio, the average trade nets over $30 and a total gain without commissions on over 1200 trades is over $39,000 on a single contract that typically has less the $4,000 margin rate. I cannot find a single indicator that can provide anything even close to these results. Every indicator I tested lost money no mater what I tried. It gets even better. So far these simple automated strategies based on this indicator are profitable in real time using real money. This may be the closest thing ever to finding the Holy Grail of Trading! The chart on the right is the profit/loss graph from these results.
The bottom line is it tests well and it works in real time! What other indicator for sale do you know that would be willing to show the back testing results? Most indicators are only accurate about 15% of the time when back tested on look inside bar with tick data and they lose money no mater how you use them. They are simply random because of there design flaws.
Shift Theory Ratio Indicator™
This is the future of technical analysis and possible the most accurate measuring tool for price data of charts. For less than you might loose on a bad trade you can own a lifetime license!
Below are more detailed articles and information on how this style of trading works and why you need to seriously consider learning how to use this product.


