RSI Relative Strength Index Learn How to Use Forex Indicators
Post on: 16 Июнь, 2015 No Comment

Overbought or Oversold? That is the question.
The RSI- or Relative Strength Index is an indicator that you have probably seen already (even if you didnt realise it). Along with Bollinger Bands and the Parabolic SAR Indicator. it is one of the most commonly used tools for trying to second guess forex markets..
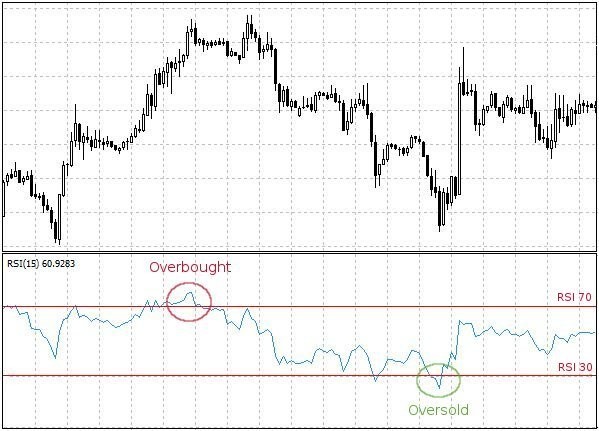
This tool was developed by a certain Mr J. Welles Wilder and is all about acceleration, or momentum of price movements. The index flip flops between 0 and 100. A currency pair is thought to be overbought when the RSI is above 70 and oversold when it heads below 30. You can also use these forex indicators to determine the overall trend (if indeed there is one).
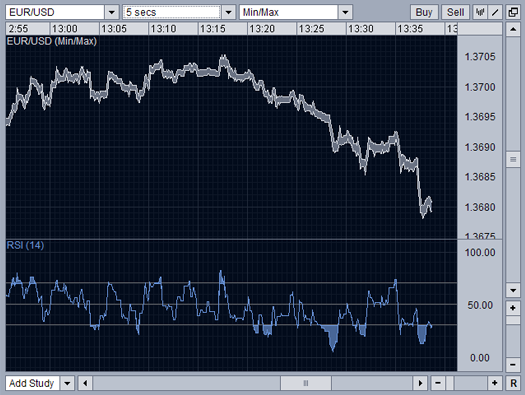
So what do those numbers mean? Well, we are not doing to completely take the engine apart here, but we will have a sneaky look under the bonnet. An RSI of zero (on any given time frame) means that the Average Gain is zero. You can change the period, but lets say we were looking at the popular 14-period RSI. If your RSI was zero here, prices moved down during all 14 periods. Conversely, RSI is 100 when the Average Loss is zero. So your currency pair moved higher for all 14 periods.
As we mentioned above, the standard period to set for an RSI is 14, but you can reduce this if you want it to be more sensitive or increase it if you want to dampen things out. So a 14-day RSI will hit overbought or oversold faster than a 20-day RSI. It will also depend on the volatility of the currency pair of course. If you are trading something with a lot of liquidity like EURUSD, its going to behave differently than if you were trading Malaysian Ringgit (USD/MYR) for example or USD/CLP (Chilean Peso).
So remember, the currency pair is overbought when the RSI is above 70 and oversold when below 30. These traditional levels can also be adjusted to better fit the currency pair you are trading. Some traders like to use 80/20 for their measure (maybe they like the 80/20 rule). Remember, there is often a lag between the RSI going overbought and the currency pair turning down. It might not even happen. The RSI is just one indicator, and must be used in conjunction with other indicators and with a solid grasp of market fundamentals (with an eye on whats coming up on the calendar as well).
When it Works Best
Like many momentum indicators (the Stochastic forex indicator is another one), RSI works best when price movement is range-bound and moving sideways.
Divergence

You can also use this indicator to try and spot market reversals. A reversal of a down trend into a a bull run is suggested when a currency pair hits a lower low and RSI forms a higher low. (RSI shows momentum building). Bears look for a currency pair heading up that hits a higher high yet the RSI hits a lower high. (RSI suggests weakening momentum and a possible reversal). If the RSI was firmly overbought or oversold, this again suggests that there may be a market reversal coming up.
Strong Trends
This all sounds great, doesnt it? But be careful- the RSI can be misleading if you are in a strong trend. You might see multiple bearish divergences before you actually hit the market top. They could just indicate a pull back but then you can trade these as well, or at least wait for the pullbcak and then buy in to the dips or sell into the highs if you prefer to trade with the trend.
Failure Swings
Another theory on how to use the RSI to predict market reversals is using failure swings. If the RSI moves under 30 (oversold), then heads over 30, pulls back, holds above 30 and then breaks its previous high, this is a failure swing (like a fakie). This might indicate a move to a bull run.
A bearish failure swing is when the RSI heads above 70, pulls back, bounces, fails to drop below 70 and then breaks its previous low.


