Premier Stochastic Oscillator Explained_2
Post on: 18 Июнь, 2015 No Comment

Forex Links
George Lane introduced Stochastic Oscillator Indicator that if used with MACD will help to make high profit and you don’t need to give time to other indicators. The study of both these indicators provides opportunities to earn high profit because both work as oscillators and their values moves between the two extremes. This indicator tells something more than the trend and helps the Forex traders and investors to trade with accuracy. This indicator helps to open long term position by observing the chart and knowing the best entry points and earn long term profit. Stochastic Indicator determines price levels at which a trend may end and also indicates the starting of a new trend or a trend reversal. This indicator also measures oversold and overbought conditions of the market.
Stochastic Oscillator Indicator is displayed in form of two lines. %K is the name of first and main line and %D is the name of the second line. The relation between the %K and %D is that the %D is the moving average of the main line %K. The solid line is the %K line and the dotted line is the %D line. Tips for interpreting a Stochastic Oscillator are explained below.
Tips to use Stochastic Oscillator
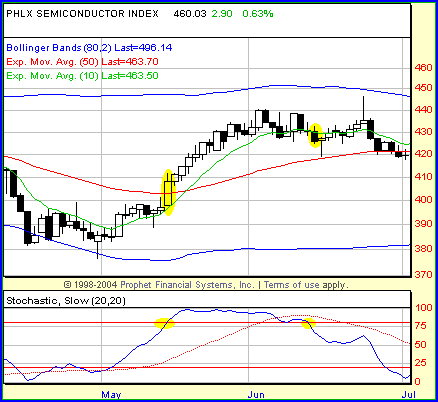
Buy if either the %D or %K line goes below a specific price level and then again moves above this level. This price level can be anything minimum, for example, 20.
Sell if either the %D or %K line goes above a specific price level and then again moves below this level. This price level can be anything maximum, for example, 80.
Buy when the main line %K rises higher than the %D line.
Sell when the main line %K goes lower than the %D line.
The calculation of Stochastic Oscillator is based on the following formula.
%K = (Close — Low (%K)) / ((High (%K) — Low (%K)) * 100
In the above formula,
Close is the closing price of today’s trading session
Low (%K) is the lowest of %K periods
High (%K) is the highest of %K periods
The main use of Stochastic is to tell us whether the market is oversold or overbought. The values in Stochastic are determined on the scale. This scale is from 0 to 100. If the stochastic lines show more than 80 on the scale then it indicates the overbought condition of the market and if the stochastic lines show less than 20 on the scale then it indicates the oversold condition of the market. In the figure below, points A, B, C and D indicate the overbought conditions and points E and F indicate the oversold conditions.
How to draw overbought and oversold areas on the chart
It is as simple as marking points on the chart. Open a chart and then go to Insert menu, click Indicators, click custom and select Stochastic. The tool will automatically draw the stochastic lines below in the chart. Now in Stochastic lines drawn, mark the points that value higher than 80 on the scale and this marked area is overbought area on the chart. In the figure above, points A, B, C and D are overbought. Now find the points that value less than 20 on the scale and mark the area. This marked area is oversold area in the chart.
The determining of oversold and overbought conditions of the market helps the Forex traders and investors to know the right time to buy or sell. Forex traders and investors buy in the oversold condition of the market and sell in the overbought condition of the market.

How to draw Stochastic
Open a chart for any currency pair. Click on the Insert menu, click on the Indicator, click on the Custom and then click on the Stochastic.
Insert —>Indicators —>Custom —>Stochastic
See the picture below to understand better.
After selecting the Stochastic as shown above, the Stochastic window opens as shown in the picture below.
Fill the values in this window as according to requirements and the Stochastic will be automatically drawn on your chart.
Do not forget that you can register on our site for free from Registration Menu to get latest news of Forex Market and Fxstay Team. Please also support us by providing link to our content in your site or blog.


