Premier Stochastic Oscillator Explained_1
Post on: 18 Июнь, 2015 No Comment

Learn Forex
Stochastics
The Stochastic was developed by George C. Lane in the late 1950s. This technical analysis tool is a momentum indicator. In an interview Lane explained how the Stochastic Oscillator doesn’t follow price movement or volume, but the speed or the momentum of the price. He explained how as a rule, the momentum actually changes direction before price.
Bullish and bearish divergences in the Stochastic Oscillator are used to indicate reversals. This was the first, and foremost, signal that Lane identified. Lane also used this tool to spot bull and bear scenarios to anticipate future reversals. Since the Stochastic Oscillator is range bound, it is also useful for identifying overbought and oversold levels.
Interpreting Stochastics
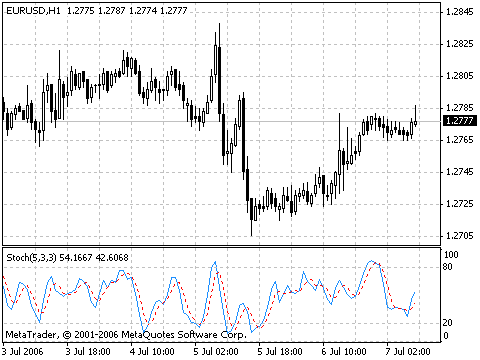
The Stochastic Oscillator calculates the level of the close of an underlying instrument relative to the high-low range over a given period of time. The Stochastic Oscillator reads above 50 when the close is in the upper half of the range and below 50 when the close is in the lower half. Low readings (below 20) indicate that price is near its low for the given time period. High readings (above 80) indicate that price is near its high for the given time period.
The most common uses of Stochastics
Identifying Overbought and Oversold markets
Since the Stochastic Oscillator is bound between 2 levels, it makes it easier to identify overbought and oversold levels. The oscillator ranges from 0 to 100. It doesn’t matter how fast the price of the instrument rises or falls, the Stochastic will always oscillate within this range. Default settings use 80 as the overbought threshold and 20 as the oversold threshold. These levels can be altered to suit a trader’s preferences and/or depending on the instrument’s characteristics. A figure greater than 80 for the 20-day Stochastic Oscillator would indicate that the underlying instrument was reaching the top of its 20-day high/low range and therefore is overbought. While, figures smaller than 20 indicate the instrument is trading at the low end of its high/low range, and therefore it is oversold.
Identifying Divergence in the market
Divergences are present in the market when a price records a new high or low but is not confirmed by the Stochastic Oscillator. Therefore, bullish divergence is signaled when the price of an instrument reaches a new low, but the Stochastic Oscillator records a higher low. This indicates slowing downside momentum which could signal a bullish reversal. On the contrary, a bearish divergence is signaled when the price of the instrument reaches a new high, but the Stochastic Oscillator records a lower high. This indicates slowing upside momentum which could indicate a bearish reversal.
Once a divergence is identified, traders should seek a confirmation that an actual reversal is taking place. Bearish divergences are confirmed when the price of the underlying instrument breaks through a support level or the Stochastic Oscillator breaks to below 50, which is the centerline. A bullish divergence is confirmed when the price cuts a resistance level or the Stochastic Oscillator breaks above 50.
Predicting Bull or Bear Set-ups
Bull or Bear Set-ups is another form of divergence, identified by George Lane, used to predict bottoms and tops in the market. A bull set-up could be explained as the opposite of a bullish divergence. The underlying instrument reaches a lower high, but the Stochastic Oscillator records a new high. Although the price couldn’t break its previous high, the fresh high recorded by the Stochastic Oscillator shows bullish momentum increasing. After this move, the next drop is expected to signal a tradable bottom.
Bear set-ups occur when the price of the instrument records a higher low, but the Stochastic Oscillator reaches a fresh low. Although the price holds above its previous low, the new low recorded by the Stochastic Oscillator shows bearish momentum increasing. After this move, the next rise is expected to signal a tradable top.
Open an RTFX Demo Account for Free and use virtual money to improve your Forex trading skills. It’s Hassle-free and Zero risk.


