Point and Figure charting technique in technical analysis
Post on: 2 Июль, 2015 No Comment

Point and Figure
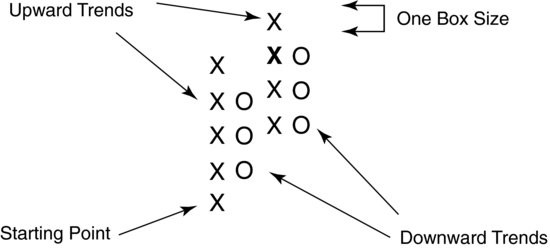
Point & Figure trend lines do not follow the exact same conventions as trend lines for bar charts, and are much less subjective. First, they do not necessarily have to connect previous tops or bottoms. Second, the way they are constructed will always result in them being charted at 45 degree angles (or -45/135 degrees if decreasing). Trend lines are very important in point & figure analysis.
Point & Figure patterns(when to BUY/SELL)
Point & Figure patterns are especially useful in determining entry points and logical stop loss points.There are few different patterns in the Point & Figure methodology. As the chart appears, they will create a series of these patterns. If the series is mostly of positive patterns, then demand is in control of that issue. If the series is mostly of negative patterns, then supply is in control of that issue.
The most common Point & Figure patterns are shown at following image with noticed buy/sell signals.
*Keep in mind, that patterns are only one of several things we look at when evaluating any equity. When analyzing the P&F charts to determine the moment to to buy or sell shares, the following criteria must be evaluated: Patterns,Trend Lines,Price Objectives, Market Indicators
There are several methods for determining the price objective on a Point & Figure chart, the most popular is the vertical and horizontal count methods. The vertical method measures the length of the thrust off a high or low and projects the thrust to obtain a target. The horizontal method measures the width of a congestion pattern and uses that to obtain a target.
The Point & Figure technique is over 100 years old. Hoyle was the first to write about it and showed charts in his 1898 book, The Game in Wall Street. Richard Wyckoff also described the technique with charts in his 1910 classic, Studies in Tape Reading. The first book/manual dedicated to Point and Figure was written by Victor Devilliers in 1933. Chartcraft Inc, in the USA, popularized the system in the 1940s. Cohen founded Chartcraft and wrote on point and figure charting in 1947. Chartcraft published further pioneering books on P&F charting, namely those by Burke, Aby and Zieg. Chartcraft Inc is still running today, providing daily point and figure services for the US market under the name of Investors Intelligence. Veteran Mike Burke still works for Chartcraft, having started back in 1962 under the guidance of Cohen. Burke went on to train other point and figure gurus, such as Dorsey.
Du Plessis describes their development from a price recording system to a charting method. Traders kept track of prices by writing them down in columns. They noticed patterns in their price record and started referring to them first as fluctuation charts and then as figure charts. They started using Xs instead of numbers and these charts became known as point charts. Traders used both point charts and figure charts together and referred to them as their point and figure charts, which is where Du Plessis suggests the name point and figure came from. Modern point and figure charts are drawn with Xs and Os where columns of Xs are rising prices and columns of Os are falling prices, although many tradionalists such as David Fuller and Louise Yamada still use the Xs only point method of plotting.
Advantages of Point & Figure charts:
- Easy to understand
It only takes a few minutes to become adept at Point and Figure charting.
The techniques are very simple and dont require math or prior knowledge of the currency trading market. Feel free to test them with any company such as FXCM .

Point & Figure charts are simple to understand and easy to apply. They clearly indicate underlying trends, allowing traders to stay calm in the face of volatility.
- It focuses or what really matters: Price movements
All other technical analysis is based on a fixed time axis a bar per given period of time. This time based bias can lead to false signals with periods of little or no up or down movement. When PRICE is exclusively analyzed, amazing and powerful trading signals emerge. The frustration of false signals is greatly reduced.
- The methodology is a chart and trading system all in one
Not only does the Point and Figure chart depict price moves, but most importantly it translates directly into a trading methodology producing clear buy and sell signals.
- It has been rigorously tested, and it works
Numerous academic studies have been conducted over a span of decades showing Point and Figure is profitable.
- There are exact decision rules
Point and Figure charts provide specific entry and exit points, eliminating the common faults of keeping a bad trade too long, or getting out of a really profitable one way too soon.
- It gets you in on the major move
In Forex this is especially important because the Currency Pairs trend very well and often give massive moves in one direction or the other. Youll be wisely holding that trade while others are jumping out.
- It works the same for both Long and Short positions
Clear Stop Loss and Profit Targets are easily calculated BEFORE the trade, no guessing required.
- It ramps up winning trades and keeps loosing ones small in scale
Using the Pyramiding Technique you ramp your profitable trades and leave your losing ones in single increment size.
- It generates crystal-clear trend lines
In contrast to the typical bar chart and other charting methods, Point and Figure is non ambiguous about where to place trend lines. Again, no guessing required.


