Pivot Points Forex Tutorial
Post on: 6 Апрель, 2016 No Comment

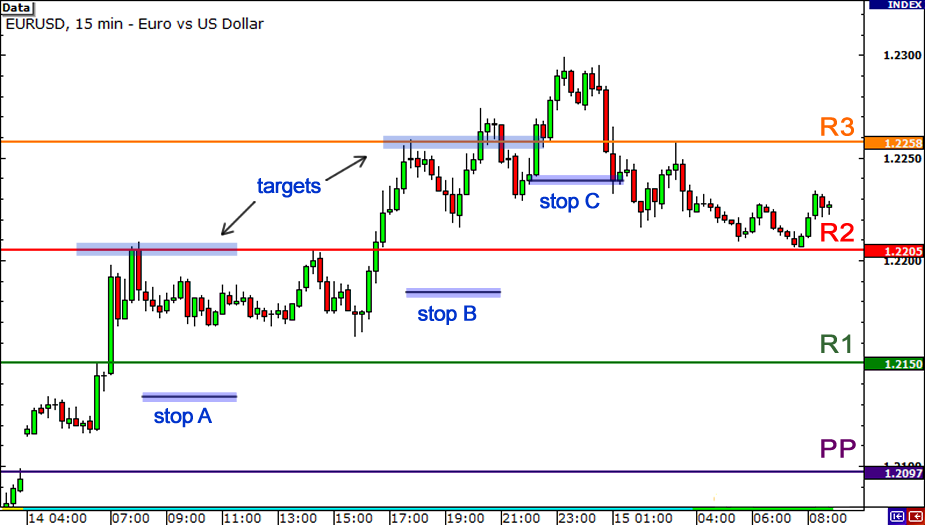
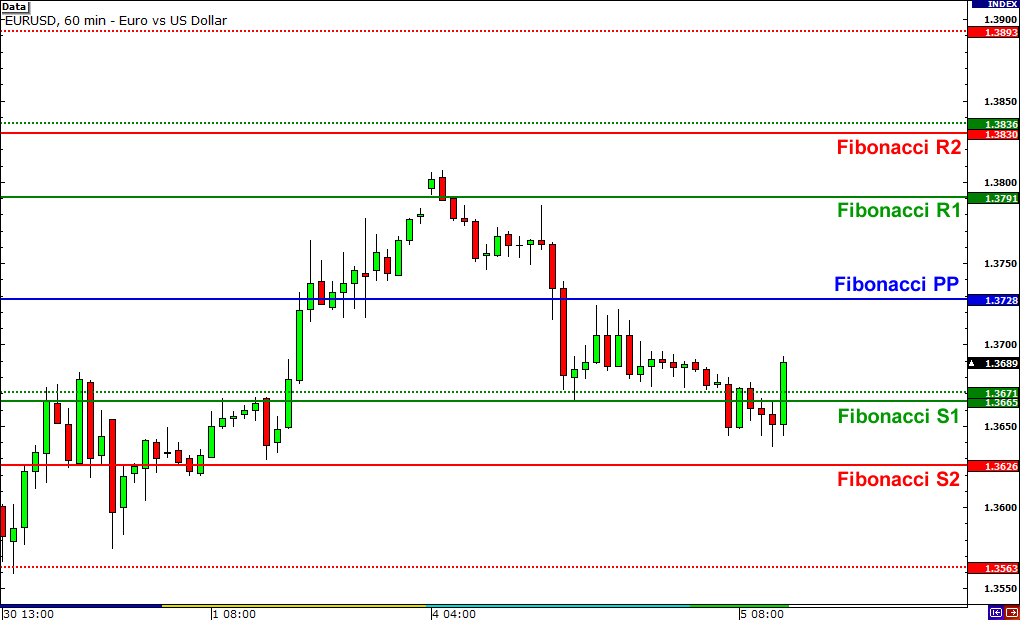
Utilisation of pivot points as part of a trading strategy is something that was originally used by floor traders. The pivot point is often considered to be a key area for intra-day traders who will look to trade a break of the pivot or a reversal from the pivot area. Calculations derived from the past days high, low & close provide various dynamic support and resistance levels and this data basically comprises all the information we require to use pivot points for trading forex and other markets. This post will look at the usage of pivot points for forex trading and other markets.
Pivot Point Video Overview
Why do pivot points sometimes provide support and resistance?
Order flow builds around the pivot point areas since many other traders keep an eye on them and the market often responds at these levels. This leads to a self fulfilling prophecy scenario and the inherent order flow is sometimes in place for a strong breakout or reversal. I find that the strongest reactions are often during the most liquid trading sessions – like the London open.
How do I calculate pivot point levels?
There are many online tools for calculating pivot points but if you need to calculate them yourself here is the formula:
R2 = Pivot + (R1 S1)
R1 = 2 * Pivot Low
Pivot Point = ( High + Close + Low )/3
S3 = Low 2*(High Pivot)
%img src=http://media.avapartner.com/banners/p912683574.gif?tag=22788&tag2=
banner_133 /%
Different approaches to trading with pivot levels.
Some of the ways these levels can be used are as follows:
- If the market is above the pivot point then the bias for the day is for longs.
- Conversely, if the market is below the pivot point then the bias for the day is for shorts.
I personally do no trade any one signal in isolation and constantly look to put the odds in my favour by having numerous support and resistance points come together as confluence . This can be anything from psychological round numbers through to trend line touches, market sentiment, moving averages etc etc…

If the market interacts with the pivot point levels while also hitting these other confluent levels then good treading opportunities can sometimes be found.
One interesting point is that the pivot often coincides with the market profile value area .
Pivot point trading strategies
- A market open below the pivot point may be seen when trading something like the FTSE or S&P500. These markets have an opening and closing time unlike the Forex market. An open below the pivot is said to be bearish and could indicate a downside directional bias. The trader may consider trading down to the S1 level or the mid-pivot point. I would consider this to be a strategy that should not be traded in isolation. The reverse of this setup would be used for longs.
- Taking a trade as price moves through the pivot point. This is another strategy that some traders use. The reality is that a simple trade through the pivot is likely to result in many whipsaws. However, if a trader waits for support or resistance to build around the pivot the approach becomes more attractive. If price has hit the pivot on three occasions and reversed a break above may be of interest as order flow builds. Add a trend line or round number and it become more interesting still. Any trade setup needs to be mastered by the individual executing it. See this article on learning how to trade a forex setup .
- Price action analysis in conjunction with pivot points and other technical levels. This is my favoured approach.
Pivot point price action examples.
Lets take a look at a chart containing pivot points and run through some of the price action.
- The first point I have highlighted on the chart below shows price approaching the pivot after a pullback and reversing just short of the level. This is not uncommon as support and resistance is not always precise in it’s nature. A failure to hit the level and subsequent drop like this can sometimes be traded if another area (Fibonacci retrace etc) comes just before the “touch”.
The failure to touch the pivot also gives a strong indication of selling pressure here and this would have encouraged traders looking to take a break of the S1 level as price moved lower.
-The S1 breakout here would have worked well and traders had ample profit taking opportunities at S2 and below. Price actually made it all the way down to S3 at the bottom of the chart.
-S3 reversal opportunity or take profit zone. Price had moved a long way to S3 and aggressive traders may have taken a bounce/reversal trade from the level. Any intra-day trader who was already short above S3 would more than likely consider taking some profits here at the very least.
-Price action bullish engulfing candle from S3 low and close above S2. Price made a decisive move away from S3 and closed above S2. After this bullish reversal a long order at S2, with a tight stop loss, could have been deployed as a potential trading strategy. Price respected the daily S2 level and continued it’s move higher after the touch.
Example chart
As mentioned previously, I do not trade pivot points unless there are other reasons for entering a trade. Anyone who has never seen these levels may find the examples here give them something new to add to their trading tool box.


