New trader here developing a Bollinger squeeze system
Post on: 20 Июнь, 2015 No Comment

Follows 0 Following 0 Follow
New trader here — developing a Bollinger squeeze system
This is an awesome forum! Thanks to everyone who has contributed information that I have been studying. Also, thanks in advance to anyone who offers me help here.
So, I am fairly new to the Forex market, and I have been experimenting with trial accounts and trying to come up with a system for trading. What I have come up with so far and what I think will work best with my way of thinking is based off the Bollinger squeeze-breakout:
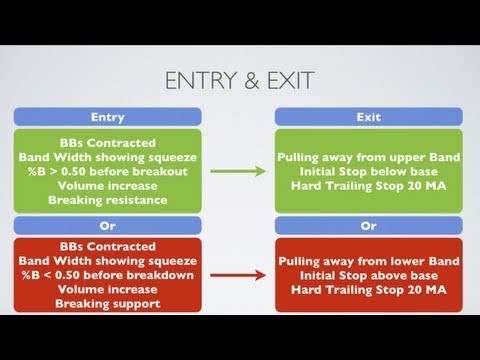
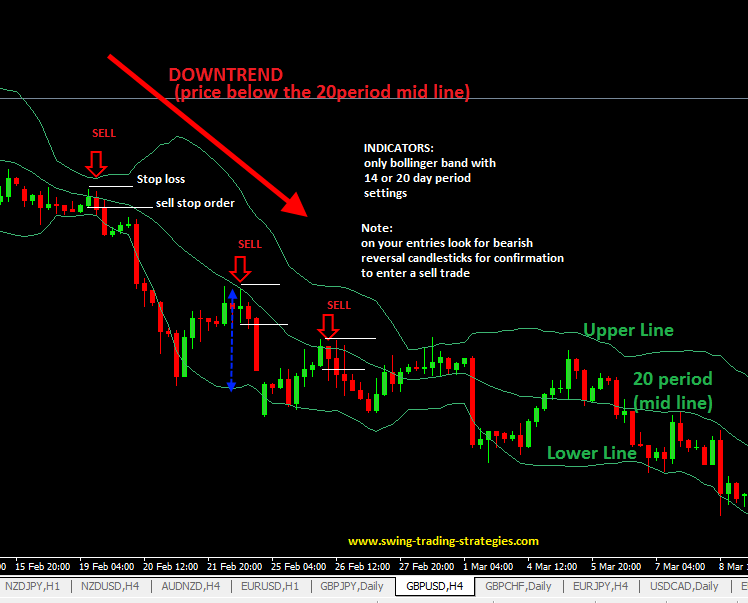
- Watch for possible Bollinger squeeze pattern — upper and lower bands getting closer together. Once a squeeze pattern is identified, watch for a breakout when upper and lower bands start getting farther apart. This could probably be applied to a Bollinger channel as well (which is essentially just an extended squeeze I guess). Once a breakout is identified, confirm direction of the breakout with RSI, Stochastic, MACD, and the SMA Bollinger center line. If price is going up, take a long position. If price is going down, take a short position. Monitor RSI and Stochastic and watch for a reversal, take profit at time reversal is identified.
Possible points of refinement / parameters to identify:

- What parameters constitue a Bollinger squeeze? Is it a certain pip range, say when upper and lower bands come within 30 pips of each other? In looking at historical data, I have noticed breakouts after higher ranges than this. Could it be based off of a percentage difference between upper and lower bands? I am very good at visually identifying patterns such as this, so I can just trade them manually for now, but I am also good at programming and will probably start to write a MQL 4 EA based off this system soon. What parameters identify a breakout? A certain percent increase from the squeeze in upper-lower band spread? When the spread reverts back to a level it was at before the squeeze or channel? What level should a stop loss be set at in case of a head fake? I was thinking at the Bollinger SMA center line at the time the position was taken, either on the 30m or 15m chart. What chart ranges work best for this method? I have had my best success so far on the 30 and 15 minute charts. Is it good to go down to 5 minute charts to help in identifying breakouts? Can the system work on 1 hour charts? What parameters on Stochastic and RSI identify the reversal? I was thinking at the time the Stochastic value line crosses the signal line in the opposite direction, or maybe just when they start getting closer together. For RSI, when it flattens out or reverses direction. Is this system a good one to use for a new trader with a small amount of capital?
Please provide constructive feedback on any and all parts of my system. I will continue to manually test it on my trial accounts, and probably start developing a MQL4 program for it. If there is already one out there, I would appreciate a link so I can examine and test it.
Thanks for reading, thanks in advance for feedback, and good trading to all!
- Share
- Share this post on Digg Del.icio.us Technorati Twitter


