Moving Averages (MA s) Forex Trading Indicator
Post on: 11 Июнь, 2015 No Comment

Written by Aboutcurrency
Moving averages (MA’s) are one of the most popular technical analysis tools used when trading forex. Moving averages lag price, in other words, if price starts to move sharply upward or downward, it will take some time for the new data to filter into the moving average calculation and for it to react or catch up.
The basic concept is, that when it is above, conditions are bullish and when below, conditions are bearish. Additionally, moving averages will slope upward or downward over time. This adds another visual dimension to the analysis.
Three types of Moving Averages:
- Simple moving average (SMA)
- Exponential moving average (EMA)
- Weighted moving average (WMA)
1) Simple Moving Average (SMA)
A simple moving average (SMA) study for a historic data chart is calculated by adding a constant number of the price data values, where the value of the constant is known as the smoothing constant of the moving average, and dividing the result by the same value of the constant. This is repeated for all data points of the drawn chart to give a series of moving average points.
NRM (mva n) = (Sum (Pi) for i = 1 to n) / n
Where P = the price value of data point, which can be selected to be high, low, close or open (default is close).
For example, to calculate a 20 days simple moving average, you need to take the sum of the closing prices from the 20 past days and divide the result by 20.
2) Exponential Moving Average
An exponential moving average (EMA) is similar to a simple moving average except that the EMA gives more weight to recent prices (increases exponentially). This also results in a greater emphasis being placed on the most recent data point.
3) Weighted Moving Average
The calculation of a weighted moving average (WMA) is similar to that of a simple moving average except that every price point is linearly weighted according to its age. The emphasis therefore is placed on the most recent price values.
This type of moving average will respond to a changing price trend more rapidly than will a simple moving average, and will be seen to cross the price chart sooner than would a normal one. The weighted moving average is therefore said to be fast
Why use moving averages in forex?
The most powerful point of the moving averages is that they are trend-following in nature and there purpose is to anticipate the beginning of new trends, or to identify new trends as soon as possible after their inception. They can be computed for any period of time. Traders find them most useful when they provide input about the short-term, intermediate and long-term trends. For this reason, using multiple moving averages that reflect these characteristics can assist.
Moving averages can be speeded up through the application of further math calculations. Common averages are known as simple moving average or SMA.
These tend to be very slow. Giving more weight to the current changes in price rather than those many bars ago, a faster exponential moving average or EMA can be created.
Many technicians favor the EMA over the SMA. Fortunately all basic price charting software programs do the calculations for you and plot price perfectly.
Most popular moving average time periods
The most common time periods used in forex are 10, 20, 50, 100 and 200 days.
Which works best?
There is no such a thing as the right time period when using moving averages. You have to feel comfortable with the time period(s) and type(s) of moving average(s) you use. Best is to experiment with a number of different time periods until you find one that fits your system or strategy.
Trading signals from moving averages
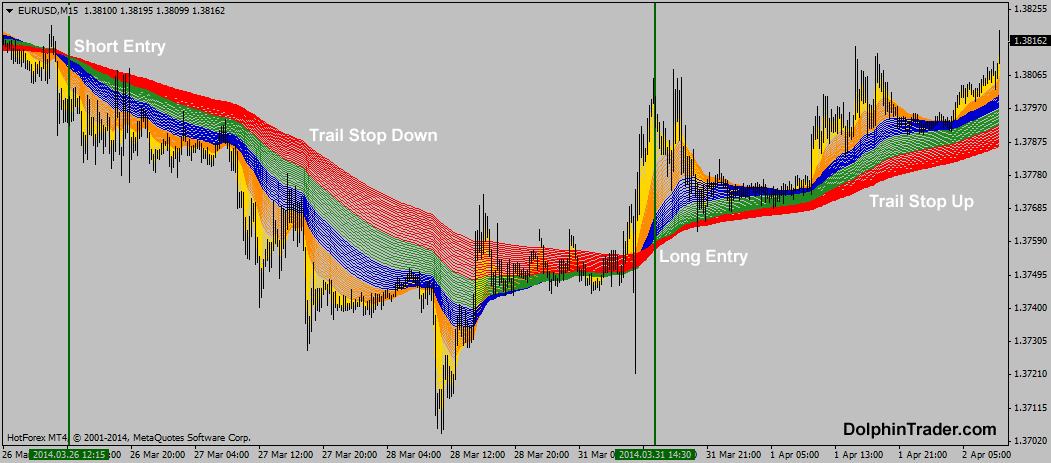
One of the most common buy or sell signals in all chart analysis is the MOVING AVERAGE CROSSOVER. These occur when two moving averages representing different trends crisscross. For example, when a short-term average crosses BELOW a long-term one, a SELL signal is generated. Conversely, when a short-term crosses ABOVE the long-term, a BUY signal is generated.
Looking to the above chart, for example, when the 10 period EMA crosses the 200 period SMA from below, this will generate a BUY signal.
or, when the 10 period EMA crosses the 200 period SMA from above, this will generate a SELL signal.
Please note: Moving Averages, as with all other technical indicators should not be used by themselves but should be combined with other indicators / studies such as candlestick patterns to make a complete forex trading system.


