Moving Average Trading Mojo
Post on: 20 Апрель, 2015 No Comment

A moving average is about as plain vanilla an indicator as you can get. You can make it more complicated if you want to with weighted, geometric, harmonic, exponential, front-loaded, and double or triple smoothing variations, but the basic function of the moving average remains the same — to smooth fluctuations in a time series data like stock or commodity prices or forex rates.
So what you say? In the 1850s prospectors on the way to the California gold fields wintered in Nevada waiting for the mountain snow to melt. While in Nevada they sluiced and panned for gold along the riverbanks. Some found a few gold nuggets but the work was hard. A heavy blue-black gunk always clogged up their prospecting equipment and, many wasted hours were spent getting it out of the way. In the early spring, when the mountain passes cleared, they continued on to California where they knew the real fortunes were to be made. Well, that blue-black gunk turned out to be rich in silver. And the folks that had the foresight to seek and find value in the throw-away stuff?
J.M. Hurst, an aerospace engineer of 1970 vintage, saw something about stock market data that nobody else before him was able to see in quite the same way: that a stock price history was not a record of a continuously changing price, but a profile of a discrete sequence of individual magnitudes related to each other by a common wedge of time. That little thought experiment made a simple moving average analogous to a digital filter that could slice stock price history into bins of frequency, amplitude and phase and, when desired, numerically recombine them into the everyday stock chart.
Such that, something like this:
When combined, looks like this:
Hurst seemed to feel that if you took enough slices from different time frames of a stock’s price history that you would have a high probability of determining, in advance, which of the classic chart patterns would fail or succeed at any particular time.
This isn’t a recap of Hurst’s book, The Profit Magic of Stock Transaction Timing . So much has been left out that we do the man a disservice. Hurst was first an engineer and he provided the mathematical details to support what he called his “price motion model.” If we accept Hurst’s thought experiment for what it is, that a history of stock (or commodities) prices can be sliced into discrete components of frequency, amplitude and phase, then the statement that moving averages “can be designed to clarify and allow inference of spectral status of stock prices at any given time” doesn’t necessarily have to be attributed to a cosmic alien.
Hurst’s contribution to our understanding of moving averages isn’t just that they smooth time series data. His contribution is that a properly designed moving average:
- exactly reduces the magnitude of cyclical fluctuations equal to that time span to zero;
- diminishes, but does not eliminate, the magnitude of cyclical fluctuations of periodicities less than the moving average; and
- all fluctuations of durations greater than the periodicity of that moving average stay visible with the smoothing effect diminishing as periodicity increases.
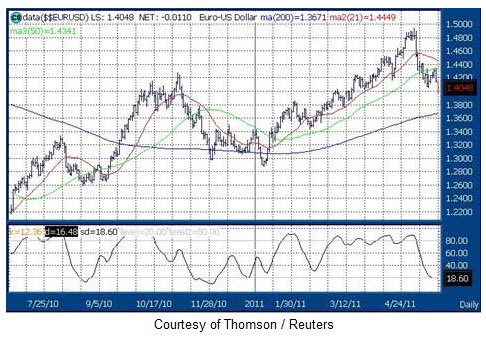
Hurst went on to say that one of the most important elements of a properly designed moving average is that it be plotted alongside a price point but that the average be offset from the current or last price. That means that Hurst’s moving averages always lag the associated stock data. Here’s what that looks like:
The net effect of understanding that (a) stock and commodities prices are discrete elements of a time series, and (b) that properly designed moving averages are analogous to digital filters is that moving averages can be used for much more than the simple crossover systems that everybody else and his brother are using. With the right technique properly offset moving averages can be used to make consistent and at times amazingly accurate price and time predictions of stock and commodity price movements. Now that’s real mojo!


