Magic of Fibonacci numbers
Post on: 16 Март, 2015 No Comment

Use them for spotting major support or resistance levels.
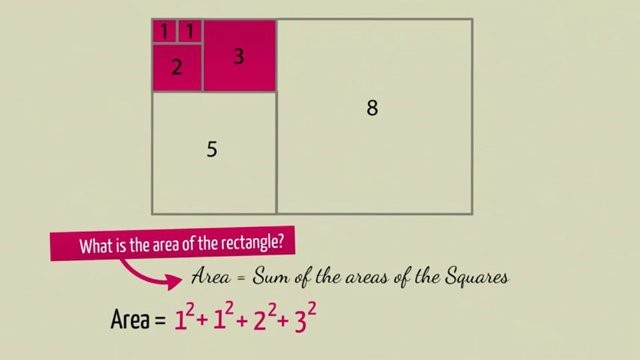
Though the Fibonacci series was first explained by Pingala, the ancient Indian mathematician in 200 BC, the credit for the present day knowledge is attributed Leonardo Fibonacci, a 13 th century Italian mathematician who discovered a simple series of numbers that created ratios describing the natural proportions of things in the universe. The ratios arise from the following number series
0, 1, 1, 2, 3, 5, 8, 13, 21, 34, 55, 89, 144
Each number in this sequence is simply the sum of the two preceding numbers and the sequence continues infinitely. One of the remarkable characteristics of this numerical sequence is that each number is approximately 1.618 times greater than the preceding number.
The key Fibonacci ratio of 61.8 per cent — also referred to as the golden ratio or the golden mean — is found by dividing one number in the series by the number that follows it. For example: 8/13 = 0.6153, and 55/89 = 0.6179.
Similarly we have 76.4 per cent, 50 per cent, 38.2 per cent and 23.6 per cent retracement ratios, derived from the Fibonacci series.
Fibonacci Retracement levels are used to identify major support and resistance levels in an uptrend, as well as in the downtrends. For applying a Fibonacci retracement study on the chart, there must be an existence of a trend, i.e the study is not advisable for being used in the range-bound price movements, where there are higher chances of getting whipsaws.
UPTREND: This is the daily chart of Aban Offshore. Here we plotted the Fibonacci Retracement Levels by clicking on the Swing Low at 224 made on March 9 and dragging the cursor to the Swing High at 1,311 made on June 8, 2009. You can see the levels plotted by the software. The Retracement Levels were 1063 (23.6 per cent), 902 (38.2 per cent), 772 (50 per cent), and 642 (61.8 per cent). Now, the expectation is that if the Aban Offshore price retraces from this high, it will find support at one of the Fibonacci Levels, because investors would be interested to get entry at these levels as the market pulls back.

Now lets look at what actually happened after the top of 1,311 formed on June 8 in Aban offshore. The stock price started to fall and did not take a support at 23.6 per cent, 38.2 per cent and 50 per cent retracement levels and kept on plummeting. Thereafter, around 61.8 per cent retracement was placed at 639, it took support and bounced back. At that time, another indicator favouring the reversal was the sudden rise in volumes on the day when price had taken support at 61.8 per cent retracement. So, this observation could have been the key trigger for entering into a long position, and cutting off the short ones. However, in this kind of scenario, other retracement levels like 23.6 per cent, 38.2 per cent, and 50 per cent do not go in vain, as they might act as a crucial resistance to levels going forward.
DOWNTREND: Now lets see how we would use Fibonacci Retracement Levels during a downtrend. This is a weekly chart of BHEL. As you can see, we found our Swing High at 2,910 on November 16, 2007, and our Swing Low at 1,325 on June 13 2008. The Retracement Levels were 2,304 (0.618), 2,117 (0.500), 1,930 (0.382) and 1,699 (.236). The expectation for a downtrend is that if it retraces from low, it will encounter resistance at one of the Fibonacci Levels. As a result, price of the BHEL took resistance exactly on the 38.2 per cent retracement level placed at 1,930 on September 12, 2008, and resumed its overall downtrend testing the level of 984 on the lower side thereafter.
LIMITATIONS: Its apparent that there a few problems to deal with. Its very difficult to identify on which level a price will take support or resistance. A trader wishing to use this tool will have to wait and see if the stock or the index actually reverses from one of those supports. If it does, then the reversal will have more credibility than other moves where a reversal happens without the support of these key levels.
The writer is director and head of research, Anagram Capital


