MACD technical indicators
Post on: 3 Май, 2015 No Comment

Trading on the Forex requires an efficient and careful examination of the technical analyses from the observation of historical and real time charts. Among the best trend indicators, the MACD or Moving Average Convergence Divergence, is particularly appreciated by professional traders and can also be used by beginner investors as from the moment when the latter are able to correctly interpret it. To help you understand this technical indicator, we will here review in detail the function of the MACD and its interpretation.
What is the MACD?
The initials MACD mean Moving Average Convergence Divergence, this is a technical indicator used on several financial markets including the stock exchange market and the Forex.
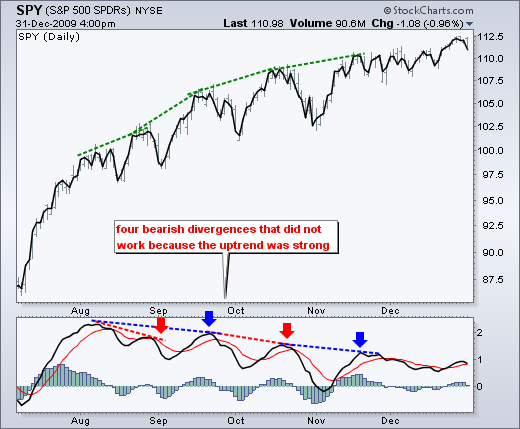
Graphically, the MACD is represented by two curves. The first of these two curves indicates the difference between two moving averages, whereas the other curve represents the moving average of this difference.
In addition, this chart indicator has three distinct parameters indicated like this MACD (parameter 1, parameter 2, and parameter 3). Each of these parameters is a figure which represents the length of the moving average for parameter 1, the length of the second moving average for parameter 2 and the length of the difference moving average between the first two is indicated by the last parameter.
How is the MACD calculated?
The MACD Indicator is calculated, as its name indicates, from the moving average convergence and divergence.
That is to say, this indicator tends to show the existing connection between two moving averages. The result obtained in this way is therefore the difference representation between these two moving averages.
Generally, and by following the traditional calculation scheme, the MACD compares an exponential moving average over 26 days that is called the long average with another exponential moving average over 12 days that is called the short average.
From the result of this comparison, you can then obtain the purchase or sale signals. On a chart, these signals are represented by a crossing at the top or the bottom of the signal line by the MACD line.
How to interpret MACD data?

Understanding the calculation of the MACD is one thing, but interpreting the results is something else. Fortunately, the conclusions resulting from the chart results of the MACD are extremely simple to understand.
As this indicator is based on the calculation of convergences and divergences of moving averages it provides a very good trend indicator since it shows the difference between the prices of two moving averages. One can therefore generally consider that the trading signals resulting from this indicator are very powerful and much more precise than those of other indicators, technical or not.
Here is the best way to interpret the MACD results:
- When the MACD passes its own line upwards: It represents a strong buying signal.
- When the MACD passes its own line downwards: It represents a strong selling signal.
- When the MACD passes the zero line upwards: It also represents a buying signal.
- When the MACD passes the zero line downwards: It also represents a selling signal.
Conclusion
The MACD, even if a little complex for total beginners is definitely one of the best technical indicators for currency trading. However, it can be used in correlation with other indicators to obtain more precise signals.


