MACD Divergence Strategy_1
Post on: 15 Август, 2015 No Comment

In todays article, we will be discussing how to use the MACD indicator in another trade strategy, known as the divergence trade strategy. The divergence trade is used to pick out profitable trading strategies based on the principle of price divergence from the MACD indicator, and the eventual correction of this price divergence to follow the MACD indicator.
There are two types of divergence trades that can be taken using the MACD indicator. There is the positive (bullish) divergence, and there is the negative (bearish divergence).
Recognizing a Divergence Trade From the Charts
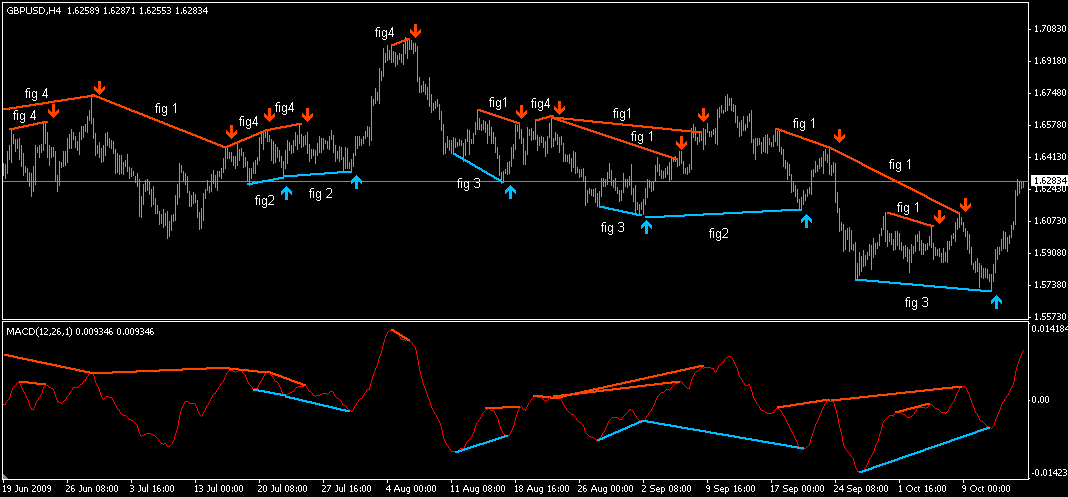
Recognizing a divergence trade on the charts will require some practice and experience. For a bearish divergence, the trader has to look for an area where the price top forms higher highs while the MACD tops form lower lows. In the bullish divergence, the trader will focus on price bottoms, and so will have to look for where the price bottom forms lower lows while the MACD bottom forms lower highs.
Once these have been identified, the trader then searches for more technical setups that will support the trade entry in the direction of the price correction of divergence. One of these is to use reversal candlesticks as the basis for the trade entry. Other indicators can also be used to confirm trade entries. For our trade examples however, we will keep it very simple by using reversal candlesticks to pick out trade entry points. Generally speaking, we see more price movement in the bearish divergence than in the bullish divergence.
Trading the Divergence
As we have mentioned earlier, there are two divergence trades that can be taken. As a general rule, the higher the time frame charts used for the analysis, the more pips that can be obtained, simply because each candlestick represents price activity over a longer period if the 4 hour or daily charts are used than if the one hour chart is used.
Bearish Divergence
The bearish divergence occurs when the price tops are making higher highs and MACD tops making lower lows. All that is needed for this trade is for the trader to identify two price tops in which the second price top is higher than the first one. This means that ideally, price must be on its way down from the second peak in order to form a complete top.
The trader then searches for an area where the MACD histogram has formed two peaks, with the second peak being lower than the first peak. Usually the higher price highs and lower MACD highs can be traced out with trend lines that connect the tops, easily revealing the different orientation of the trend lines. Thus the divergence is named after the MACD indicators orientation.
Take the short entry trade by looking for a bearish candlestick pattern following the MACD divergence. Then enter short at the open of the next candlestick following the candlestick reversal pattern.
Stop Loss: The stop loss should be placed above the second (higher) peak of the price action.
Take Profit: The take profit levels should be considered using the following:
a) The nearest key level of support
b) The appearance of signs of price bottoming out e.g. recurrent price troughs at the same area following downside price movement.
c) The trader may also decide to set a risk-reward level of 1:2, where 2 pips are allocated as profit for every pip that is set as stop loss.
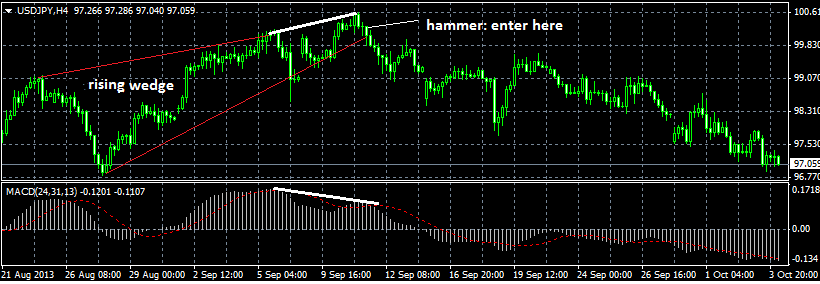
The chart below shows a typical bearish divergence trade:
Here we can see that the price action is making higher highs while the MACD is making lower highs. A closer look will also show that the price action is working within the context of the rising wedge, which in itself, is a bearish forex chart pattern. So this is really a great trade setup which a forex trader should look forward. All that is left is to identify a bearish candlestick, which is shown by the doji and then a hanging man (pinbar), which is the signal the trader needs to enter short.
Bullish Divergence
The bullish divergence is seen when the price bottoms to form two troughs in which the second trough forms at a lower level than the first trough while at the same time, the MACD histogram forms two bottoms of which the second bottom is higher than that of the first bottom, effectively making making higher lows. The traders job is therefore to identify these areas, trace the lines and then look for a bullish candlestick that can be used to initiate the trade. Once more, the bullish divergence is named after the MACD indicators orientation.
The long entry trade is initiated by looking for where a bullish candlestick pattern occurs once the MACD bullish divergence is confirmed. The long position is taken at the open of the next candlestick which occurs after the candlestick reversal pattern.

Stop Loss: The stop loss should be placed below the lower of the two peaks of the price action.
Take Profit: Just like in the bearish divergence (albeit in the opposite direction), the trader can set the take profit levels using the following parameters:
a) The nearest key level of resistance, either formed by a pivot or a recent succession of price highs.
b) The appearance of signs of price topping out e.g. an area where two or more price peaks have occurred.
c) The trader may also decide to set a risk-reward level of 1:2, where 2 pips are allocated as profit for every pip that is set as stop loss. So the calculation can be made from the entry price and the stop loss.
The chart below shows a typical bullish divergence trade:
We can see the bullish divergence occurring where the price is making lower lows. A bullish engulfing pattern then forms at the trendline area, marking the start of the upside price correction which is what is traded here. The price went up and eventually topped out after a massive 712 pips movement.
We can see clearly that divergence opportunities are everywhere with us in the forex market, but it takes some skill to be able to spot them when they occur. Moreover, the best charts to use are the long term price charts (such as the daily chart or 4 hour chart), as these deliver clearer signals devoid of market noise and usually yield more profits for the trader.
To properly trade divergence patterns therefore, try to get familiar with the major candlestick reversal patterns found in the market, as these provide the easiest technical basis with which to enter trades. Other trade triggering parameters can be used, but for beginners, it is better to stick to candlesticks in order to get the easiest entry setups into profitable trades.
Attention!
The author’s views are entirely his or her own!


