Learn Technical Analysis in Forex Trading Free Online Training Course
Post on: 8 Май, 2015 No Comment

Technical analysis is a very broad subject. Here we have try to cover basics as well as some advance topics. It can provide you good understanding of how to use technical analysis while trading forex.
1. What is Technical Analysis for Forex Trading. – An Introduction
Technical analysts use charts, indicators and other drawing tools to understand the future possible price movements and its direction. Read more>>
2. Fundamental Analysis vs Technical Analysis – Evergreen Debate
Fundamental analysis and technical analysis are two different methods of analysis. There is a major controversy between these two analytical methods. Read more>>
3. Significance of Volume in Forex Market
Volume is always foremost in case of financial trading or investing approach. Volume gives us idea about various things such as, traders’ activity, volatility, buying or selling pressure etc. Read more>>
4. Various Methods of Charting
There are different types of technical charts. Three types of charts are available in most trading platforms for forex trading. These charts are. Read more>>
5. Candlestick Charting Explained
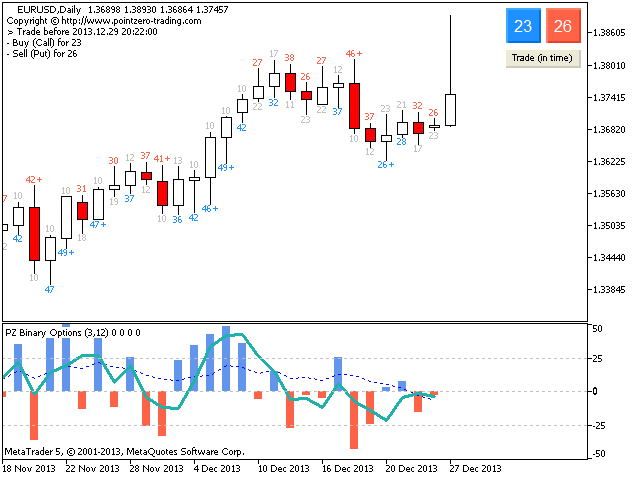
Candlestick charts are probably the most commonly used charts by forex traders. This is the preferred method of displaying price action. Read more>>
6. What is Support and Resistance and How To Use it
Support and resistance is one of the major concepts in trading. Support and resistance are psychological price levels where forces of supply and demand meet. Read more>>
Trade lines are very important tool in technical analysis. It used for judging entry and exit timing while trading. Read more>>
8. Understanding Chart Patterns in Technical Analysis
Charts patterns are identified by drawing trend lines and vertical support-resistance lines. We can figure out the future possible price hikes by identifying chart patterns. Read more>>
Double top and double bottom are simple, profitable and classic chart patterns. They are reversal patterns. Read more>>
11. Trading with Hook Reversal Pattern
Hook reversal pattern is a candlestick pattern which also found in bar chart. This pattern can be either bullish or bearish. Bullish hook reversal pattern is generally found after a downfall. Read more>>
Triangles formed by drawing two converging trend lines. Each trend lines consist at least two or more price points. Read more>>
13. Continuation Patterns Rectangles (Bullish and Bearish)
Rectangles formed by drawing two horizontal lines, one horizontal line includes high points only, and another horizontal line includes low points only. This pattern also called “Box” or “Trading Range”. Read more>>
14. Continuation Pattern Flags and Pennants
Flags and pennants are very effective and profitable continuation chart patterns. These two chart patterns found after a sharp price movement. Read more>>
15. Theory of Gaps
Gaps are specific candlestick pattern and generally occur when there is a significant gap between two candles. In this case, the low and open price remains higher than the high and close price of the previous candle. Read more>>
16. Volatility Indicators – Bollinger Bands Explained
Bollinger band is a volatility indicator developed by John Bollinger. This indicator measures volatility based on standard deviation. Bollinger band is most used volatility indicator. Read more>>
17. Trading Forex Using Price Channels
Price channel indicator is a volatility indicator which is similar to Bollinger bands. This indicator appears as two lines set above and below the price of a currency pair or other trading instruments. Read more>>
Moving averages. also called MAs in short, are the most widely used and oldest technical indicator used by traders because of its simplicity in both construction and uses. Read more>>
RSI (Relative Strength Index) is an extremely popular and widely used leading or momentum indicator developed by J. Welles Wilder. RSI gauges the speed and change of price movements. Read more>>
There are several trading signals of RSI which can offer buy and sell signals. These signals are. Read more>>
21. How to Use MACD Indicator Explained
MACD or Moving Average Convergence Divergence is a very popular and widely used indicator in technical analysis. MACD can determine both trend direction and momentum change which has made this indicator very popular. Read more>>
22. Stochastics Indicator – (Ranging Indicators / Oscillators)
Stochastic oscillator is a popular technical indicator that is used in the short term, midterm and long term trading. This indicator was developed by George C. Lane in 1950. The stochastic indicator is a momentum indicator. Read more>>
23. Williams %R Indicator – (Ranging Indicators / Oscillators)
Williams % R is a leading indicator described in 1973 by Larry Williams. It is an effective and a famous technical indicator. This indicator is used mostly in case of short term trading methods.Read more>>
24. Commodity Channel Index (CCI) – A Popular Oscillator
Commodity channel index (CCI) is a popular oscillator which was developed by Donald Lambert. He described this oscillator in Commodities magazine in 1980. Read more>>
25. Parabolic SAR Indicator – Trend Indicator

Parabolic SAR is a trend indicator and generally used for short term to midterm trading strategies. This indicator was first described by Welles Wilder in his book “New Concepts in Technical trading Systems”. Read more>>
26. Trading the Rate of Change (ROC) Indicator
The Rate Of Change (ROC) is a momentum indicator that measures the price change percentage of a specific number of look back periods. ROC simply compares the current price with the price of n number of periods ago. Read more>>
27. Trend Indicator – Average Directional Index (ADX)
Average Directional Index (ADX) is a unique trend indicator. This indicator can measure the trend strength besides trend direction. In 1978, Wilder described ADX in his book named “New Concepts in Technical Trading Systems”. Read more>>
28. Volume Based Indicator – On Balance Volume (OBV)
On Balance Volume or OBV is a volume based indicator that measures buying and selling pressure. This indicator focuses on the relation between volume and price. This indicator was described by Joe Granville. Read more>>
29. Using Gann Fan Indicator in Trading
Gann Fan is a popular trading tool. It is basically a drawing tool developed by a financial genius William Delbert Gann. This incredible trading tool has used by traders for decades. Read more>>
30. Types of Japanese Candlestick Patterns
Japanese candlesticks are developed with 4 price data derived from the market. These data are open, high, low and close price. Read more>>
31. Trading With Spinning Tops and Doji Candlestick Pattern
Spinning tops and doji are candlestick patterns. These are generally neutral candlestick patterns that indicate indecision between buyer and seller. Read more>>
32. Forex Pivot Points Trading Strategy Explained
Pivot points are levels of support and resistance in the market. They are calculated with a mathematical formula that uses the previous trading period data. Read more>>
33. How to Use Fibonacci Retracement Levels in Forex Trading
Fibonacci is a series of numbers developed by Leandro Fibonacci. In this series, one number derives from the sum of two previous numbers. Read more>>
34. Difference between Retracements and Reversals
In many cases, traders get confused about retracement and reversal in a major trend. There are many significant differences between retracements and reversals. Read more>>
35. Simple Guide to Elliot Wave Trading
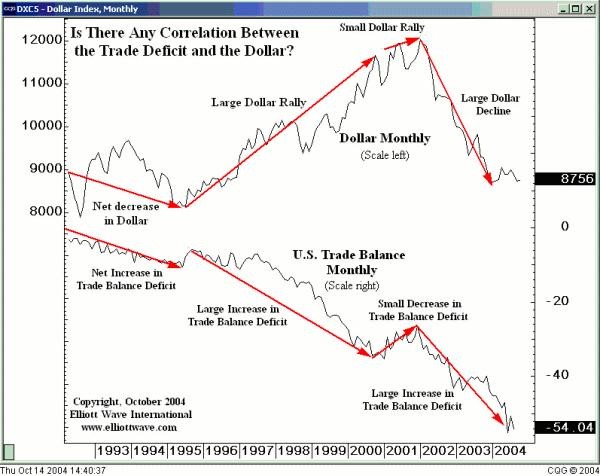
The Elliot Wave principle is a form of TA that relies on trying to predict future market cycles and trends. Its a quite old prediction tool. Read more>>


