Learn Forex Trading with MACD
Post on: 3 Май, 2015 No Comment

The Moving Average Convergence/Divergence indicator, often called just MACD, is usually one of the first learned by new traders, and in many cases — this is one of the first oscillators that traders will apply to their chart.
Unfortunately, MACD does not work all the time (which is something that can be said about every indicator based on past price information); and as such many new traders will often eschew MACD after noticing that not every signal would have worked out productively.
In this two-part series, were going to look at how MACD is constructed, as well as an additional input setting that may allow traders to take better advantage of the indicator; well then move on to look at 3 specific strategies that traders can look to use with MACD in our next article, Three Simple Strategies for MACD.
What Makes up MACD?
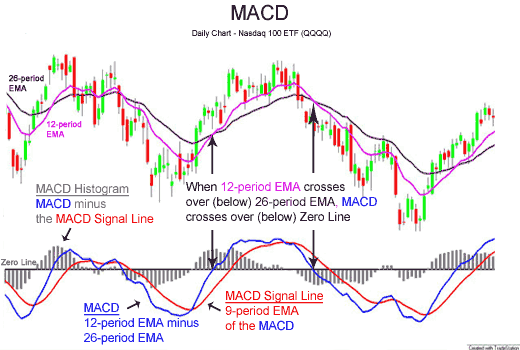
MACD is a very logical indicator, and it does just what the name describes: It measures the spatial relationship of 2 Exponential Moving Averages.
The most common default inputs for MACD are using EMAs of 12, and 26 periods — along with the signal line of 9 periods. For now — lets just focus on the MACD line itself, which is simply the difference between the 12, and 26 period EMA (using default inputs).
In down-trending markets, the fast moving average will move down faster than the slow moving average. As the fast moving average diverges from the slow moving average, MACD will illustrate that relationship. And in up-trending markets, the 12 Period EMA should move up faster than the 26 Period EMA. As such, MACD will move higher to express this growing difference between the 12 and 26 Periods Moving Average. The graphic below will illustrate this relationship, with the 12 and 26 period EMAs applied on the chart along with MACD using 12, and 26 periods (signal line removed for examples).
Created with Marketscope/Trading Station II
Notice that MACD helped traders notice the trend change from a very early stage, as the blue boxes above began before the downtrend was completely finished.
This is a key part of the indicator, and something we will delve much deeper into with our next article on 3 MACD strategies: Using MACD as a trigger into trades. But before we get to that, you probably noticed the 0 line drawn on the MACD indicator in the above chart. This is a key part of the indicator, as it shows us when there is no difference between the EMAs.
MACD will cross the zero line as the fast Moving Average intersects the slow Moving Average. The picture below will illustrate in more detail:
Created with Marketscope/Trading Station II
The Signal Line
As we saw above, MACD can be helpful for noticing potential trend changes at the very early stages of a currency pairs move.
However, if we wait for a 0 line crossover (MACD to cross the 0 line), we are essentially trading a Moving Average Crossover — which is inherently lagging the market and may not be the optimal point of entry.
This is where the Signal Line comes into play. The signal line is simply a moving average built on the value of the MACD line. By default, this value is commonly set at 9 periods.
Building on the relationship of the MACD line itself, traders will often look for entry opportunities when MACD crosses the signal line.
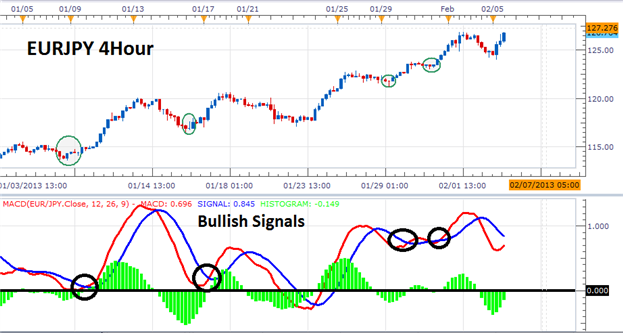
When the MACD line crosses ABOVE and OVER the signal line, it is looked at as a signal to BUY. When MACD crosses below the signal line, it is often looked at as a signal to SELL.
Created with Marketscope/Trading Station II
As you can see from the above graphic, some of these MACD signals would have worked out beautifully, while others leave something to be desired.
This highlights the reason that traders will often want to look at other indicators or mechanisms of deciding which signals to take or which to ignore. We will go over this in-depth with out article Three Simple Strategies for Trading with MACD.
But, an alternative for traders is to simply use different inputs. This can accomplish the goal of slowing down or speeding up MACD to the traders individual preferences.
The Histogram
In an effort to more closely follow the relationship between the MACD and Signal lines, traders can follow the Histogram, which is simply a bar chart plotted around the 0 line to indicate the relationship between the MACD and Signal Lines.
Notice in the graphic below — when MACD crosses the signal line, the Histogram will appropriately cross the 0 line. When MACD crosses up and over the signal, the histogram will climb above the 0 line — and when MACD crosses down and below the signal, the histogram will drop below the 0 line.

Created with Marketscope/Trading Station II
MACD Inputs
The default MACD inputs of 12, 26, and 9 are the more common settings for the indicator. (The fast MA is listed first, followed by the slow MA, followed by the input of the signal line).
However, this may not be amenable to traders goals these inputs may generate too many signals of questionable quality.
Traders looking to take signals solely from MACD, without any additional indicators to assist in grading trends or momentum are often better served by slowing down the indicator by using longer-period moving averages in the inputs.
A common set of inputs to accomplish this goal is the inputs of 21, 55 periods. The chart below will show the difference between the default of 12, 26, and 9 (above) with the inputs of 21, 55, and 9 (below).
Notice that the MACD indicator below gives fewer signals, with the goal of each signal being more reliable.
Created with Marketscope/Trading Station II
— Written by James B. Stanley
To contact James Stanley, please email Instructor@DailyFX.Com. You can follow James on Twitter @JStanleyFX.
To join James Stanleys distribution list, please click here .
Would you like a customized curriculum to walk you through Trading Education? Take our Trader IQ quiz and receive a full lesson plan with numerous free resources to expand your information arsenal.
DailyFX provides forex news and technical analysis on the trends that influence the global currency markets.


