Japanese Candlesticks in Forex Trading
Post on: 2 Август, 2015 No Comment

6.1. What are Japanese Candlesticks?
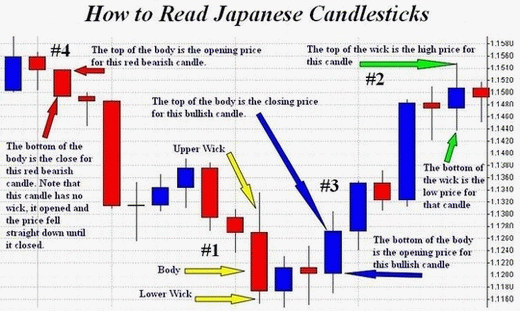
Japanese candlesticks is the charting technique which makes it easy to see the relationship between the opening and the closing prices for specific periods of time (e.g. for a day, an hour or 5 minutes). The thick part of the candlestick is called the real body. It shows the distance between the opening and the closing prices for the period of time the candle represents. If the closing price is higher than the opening price, the body is white. If the closing price is lower than the opening price, the body is black. The thin lines above and below the candlestick body are called shadows .
White or Bullish Candlestick
Click to Enlarge.
Note. Colours for each candle type can vary depending on the forex charting software that you use.
Candlestick patterns provide immediate feedback (once they are completed) on the state of the balance between the buying and selling forces that operate in the marketplace. This benefit makes Japanese candlesticks an ideal tool for staying alert to the frequent sentiment shifts characteristic of the Forex market and is behind their popularity among professional forex traders .
6.2. Examples of Candlestick Patterns
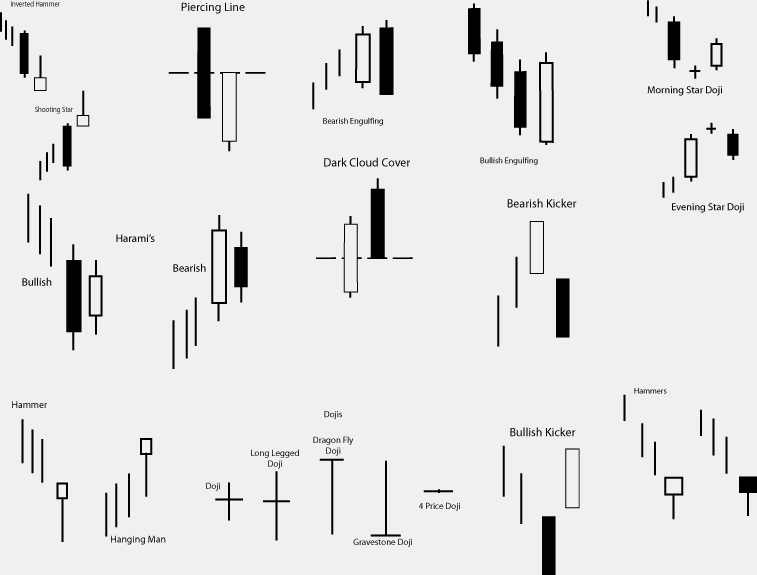
6.2.1. Hammer . A hammer is a bottom reversal signal. It has long lower shadow and a small real body (black or white) at its top. There should be a downtrend preceding this formation in order for the hammer to reverse the trend. The stronger the downtrend before it and the longer the lower shadow (ideally twice the size of the real body) — the more bullish this formation is.
An example of the hammer which appeared on the daily EUR/USD chart.
Click to Enlarge.
6.2.2. Shooting Star. a shooting star is a top reversal signal. It has long upper shadow with a small real body (black or white) at the lower end of its range. Since the shooting star is a top reversal signal, it should appear after an uptrend. Longer upward shadow coupled with a gap from the previous candle’s high increase reversal potential.
An example of the shooting star which appeared on the daily CAD/JPY chart.
6.2.3. Doji. a doji can be a top or a bottom reversal signal. It is one of the most important candlestick patterns signalling indecision amongst the market participants. This formation has horizontal line instead of a real body or very small real body (because open and close are the same or almost the same). A doji is more powerful if it appears after a long white candle in an uptrend or a long black candle in the downtrend. It is best to wait for confirmation of this pattern in the form of a long black candle for tops or a long white candle for bottoms. The longer the shadows of a doji the more likely the reversal.
Two Dojis stop the uptrend on the daily USD/JPY chart
One Doji ends the sharp downtrend visible on the daily GBP/JPY chart
Click to Enlarge.
6.2.4. Dark Cloud Cover. this is a bearish reversal pattern which appears after an uptrend. Dark Cloud Cover is formed by a black candle closing below the midpoint of the previous white candles real body. The lower the second candle closes into the first candle, the stronger the signal. The larger both candles are, the more forceful the reversal is likely to be.

The Dark Cloud Cover stops the uptrend in the EUR/GBP
Click to Enlarge.
6.2.5. Piercing Line. this is a bullish reversal pattern which occurs after a downtrend. The piercing line is the opposite of the dark cloud cover. The higher the white candle pierces into the black candle, the stronger the bullish signal.
Ideal Piercing Line
Piercing Line ends the downtrend in the CHF/JPY pair
Click to Enlarge.
6.2.6. Engulfing Pattern: this pattern is a major reversal signal composed of two real bodies of different colour. The real body of the second candle should completely engulf the real body of the previous candle. The larger the real body of the second candle than the real body of the first candle and the stronger the preceding trend the more significant the reversal signal.
Bearish Engulfing Pattern


