Interpreting Trend Lines In Forex Trading
Post on: 28 Май, 2015 No Comment

If you have been dabbling with technical analysis in forex trade, it is unlikely that you would not know about trend lines. These trend lines are the basics on which the entire charting process is based and in a way it forms the backbone of most trading activity across forex markets. In simple terms, a trend line is based on historical price action and represents the general direction in which the trade is expected to progress and give you an idea about potential support and resistance levels .
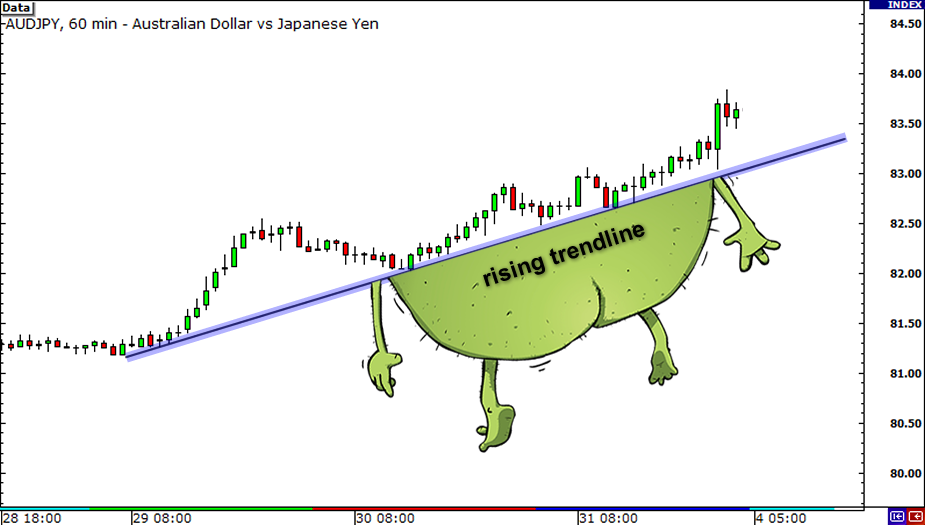
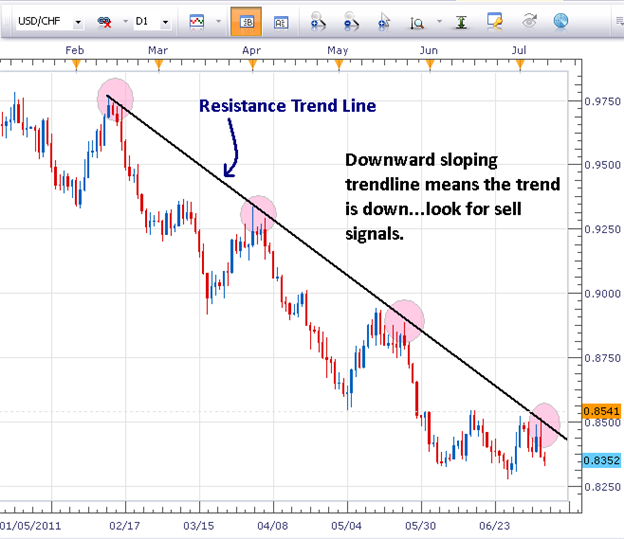
However, one must remember that drawing a trend line can be at times very subjective. One sure way of gauging the validity of a trend line is by checking the points they touch as they chart the direction of trade. Usually in an uptrend, a strong trend line should be connecting the relatively low points on the chart. Thus in a long-term rally, this line connecting all the lows forms the support line and can be used as a floor for trading. Similarly, the reverse is expected in case of a downtrend. A strong trend line covers every high, and the resultant chart should be an ideal means of determining the resistance zone for traders.
The Best Approach To Draw Trend Lines
Now we reach the most important point, how to draw a trend line that is perfect. It will be next to utopia if you expect even three points to coincide on a chart in one straight line. Normally prices would be trending close to the trend line with maximum possible points veering as close to a straight line as possible. Different traders might end up charting varying trend lines using the same set of price level. The most basic forms of trend lines are the ones that are drawn by connecting the points or the support area in the course of an uptrend or the peaks or the resistance points during a downtrend.
Another problem that you might face while charting these trend lines is that several times you might have to redraw them or revise them if there is any sudden action in the market and new highs or lows spring up on the screen. Thus, flexibility and adaptability are very important while drawing these trend lines. You need to watch out for two major highs or lows and connect them to get a proper workable trend line in forex trade.
This is how FxKeys Robot plots the trend lines.
Using Milestones In Market To Chart Trend Line
One reason differences crop up in the course of drawing the trend line is the data that is taken into account for charting it. While some might use the highs and others could be using the lows. Some traders might chart trend lines with the help of closing prices or the opening rate. Even on a candlestick the difference in interpretation can take place based on whether the wicks of the candle is considered or the solid body while making deduction and drawing up the trend line.
However in general, it is observed that the closing prices serve as more important reference levels on the chart compared to intra-day prices. Any spike through the course of trade might not totally make a trend line totally invalid. It is dependent on several aspects and key factors along with the tick by tick price action.
However, a major roadblock in this area is a lack of understanding in charting these. Somehow trend lines are among the least used tools of technical analysis. If drawn correctly, they can be ideal for accurate technical analysis and prediction but most times traders end u making line that fir the situation instead of the vice versa where the line would be a reflection of the market situation.
Different Kinds Of Trends
The logical issue to follow is then what are the various kinds of trends you can chart using the trend line. Normally the types of trend do not change with the change in the trader drawing these. In any given situation, you will always end up having one of the following two trends.
Uptrend: This is a trend line that is achieved by connecting the troughs during a specific period of trade in the forex market. Formed by joining all the low points, they reflect the potential upmove or upward trend that is being seen in the market or that which is about to unfold.
Downtrend: Just the opposite of uptrend, it is a line that highlights the increasingly lower highs that are seen in the market and that which signals the onset of a downward spiral of prices in the forex market.
Of course, markets move sideways too. The name says it all. It is a state in the market where prices have been ranging within a narrow band and the trend line if drawn correctly would reflect this phenomenon on the charts.
However as a trader and the forex market investor, there are some key factors that you must always take into consideration whenever an analysis is drawn with reference to a trend line.
You need at least three highs or lows to validate and confirm a trend line. A valid trend line is possible using two tops or bottoms also, but a confirmation happens only when you get three points.
A steep trend line generally reflects a relatively less reliable interpretation and the chances of it breaking are much higher.
Time tested trend lines are the best bets. Just like it works in case of support points or resistance levels. trend lines that are tested several times over a period tend to yield the most profitable deductions.
The trend line that you are drawing should not just fit in. On the contrary, it should emerge out of the market action. Markets never perform as per a pre-recorded script and neither should he trend lines be that way. They need to be dynamic and flexible always reflecting the updated and precise state of action.

How to Trade Trend Lines
You would wonder what’s so special about this question. It is but obvious that once the trend line approaches a support or a resistance levels a specific set of probabilities only happen, the price can either breach that level, price action might reverse or prices might hover around the specific point. Here is a sneak peak at how you can trade each of these situations differently.
Handling A Pullback
If the trend line indicates that a pullback is in the making, prices reach the trend line and reverse the direction of trade, this is your cue to enter the markets and cash in on the dominant trend that is apparent. In the case of the uptrend, it would be buying the lows and in a downtrend, selling the highs. If you are buying during an uptrend situation then always remember to keep the limit order just above the support level .
When The Trend Breaks
When the trend breaks or in other words the support or resistance levels is breached you need to keep the approach same as any other breakout in the market. Identify the entry point based on the demand supply dynamics and the resultant chart movement.
Thus to conclude, a trend line is a simple and effective tool for the technical analysis of the market. They are easy to comprehend and very adaptable. They can be conveniently used along with other tools or individually to project the course of future trade or analyze the current trading action based on historical records. Always remember to connect swing lows with other swing lows and similarly highs with highs. Try and draw trend lines that are not broken, a break invalidates them. Remember the old saying, the more the merrier. It applies 100% while drawing trend lines, the more dots you can join, the stringer the trend line is. And as with any trade, always buy the bullish looking trend lines and sell the ones that appear bearish.
You can install the FxKeys Robot on your platform and see it plots the lines on the charts and reports the breakouts. It is a big help to learn how to plot the lines on the charts.
Don’t Miss Our New Articles!
Be the first who receives our most recent articles:
Learn more:


