Indicators MACD RSI and ADX made simple
Post on: 2 Апрель, 2015 No Comment

Indicators are used by forex traders to assist with trading decisions and can be a powerful addition to many trading strategies. Indicators are applied to the price charts of forex pairs and can provide a trader with an additional understanding of the market and offer the all-important ‘edge’ to being successful. Although there are hundreds of indicators available, there are several key indicators used by forex traders which are considered the most reliable and effective. These can be grouped in to those indicators which are ‘trend-following’ indicators and those which are considered as ‘momentum’ indicators. Whilst both of these are effective, it is important to understand the broad differences between these groups are that ‘trend-following’ indicators are often lagging and reflect historical price data whilst momentum indicators are used for their predictive qualities.
MACD
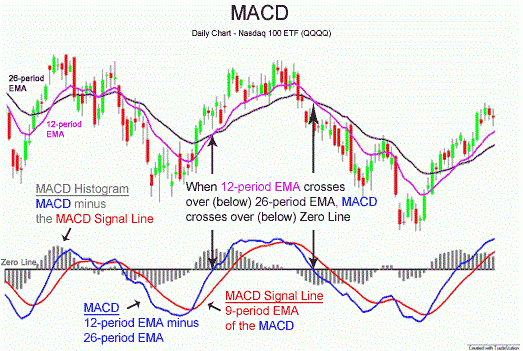
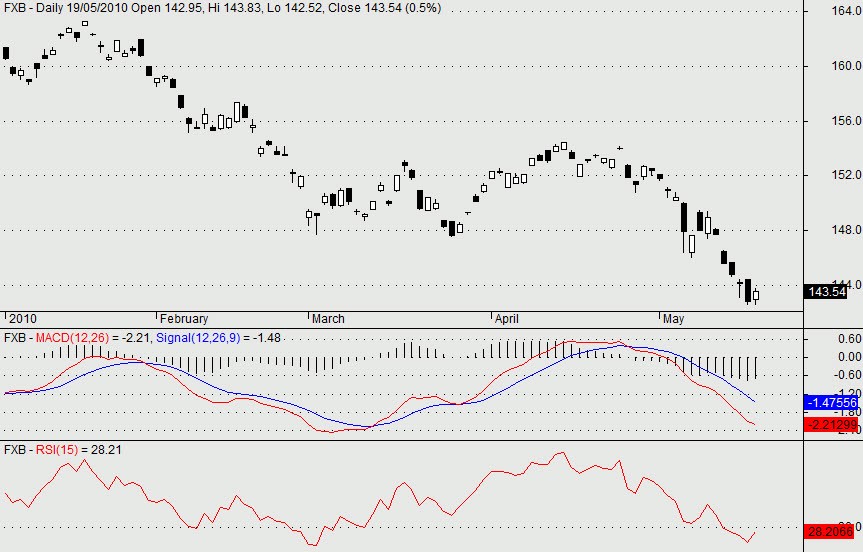
The MACD (moving average conversion-divergence) indicator is a favourite of many forex traders due to its ability to combine both the trend-following and momentum groups in to one indicator. It is used to identify the strength of the price and potential for direction change. As the name suggests, it identifies the divergence consists of two exponential moving averages. The ‘MACD line’ is calculated as the sum of the 12 EMA minus the 26 EMA and the ‘signal line’ is the 9 EMA of this sum. The ‘divergence’ is created when the MACD line crosses over and moves above of below the signal line, resulting in a positive or negative MACD reading. Traders use the MACD to confirm long or short forex positions and trade both the crossovers of the two lines and the positive or negative histogram reading generated by the divergence.
Relative Strength Index (RSI)

The Relative Strength Index is a momentum indicator measuring strength of the market in relation to whether it may be considered ‘overbought’ or ‘oversold’ and therefore the potential for further movement higher or lower. The calculation for the RSI includes the average gain and average loss over a period of 14, plotting the values on to an index with the values 1-100. Traders consider that when the value of the index reaches above 70 the currency pair may be considered overbought. Conversely, an index reading of below 30 represents an oversold value, suggesting that a correction or reversal may be imminent. The predictive capability of momentum indicators such as the RSI provides a valuable tool to forex traders. Used in conjunction with another indicator or trading signal, they can reinforce the decision to trade when the current price is considered ‘overbought’ or ‘oversold’. RSI, similar to the MACD, also shows traders when the strength of a current price move is diverging from the underlying strength. Divergence seen on the RSI can further be a signal of future correction or reversal of the price.
Average Directional Index
For trend traders, the ADX is an excellent tool for measuring the strength of the current trend. Using an index, the ADX will reflect high values for those forex pairs with a strong trend. This allows traders to quickly analyse whether a trend trading strategy can be employed on a currency pair. Although the ADX is a lagging indicator, and therefore does not have the direct predictive value of the MACD or RSI, it can be used to show when a trend is particularly strong and likely to come to an end. Similarly, a low reading on the ADX shows traders that the pair is range-bound and the potential for a breakout trend in the future is high.


