Identify Market Entries with Fibonacci
Post on: 27 Май, 2015 No Comment

Talking Points:
- Trendlines are Popular Tools in Directional Markets Fibonacci Calculates Values Between Two Points Use the Two Together to Find Support & Resistance
Drawing trendlines can be a great way to determine support or resistance values when a strong market trend is present. However, trendlines by themselves leave a lot to be desired when it comes to finding entry points, particularly when price becomes extended. Below the GBPUSD provides an example. The pair is in a notable downtrend, yet potential entry points remain unclear. To help identify these points we will take a look at how retracement traders can plan an entry based on a trendline through the application of the Fibonacci retracement tool. Lets get started!
Learn Forex GBPUSD Daily Trend
(Created using FXCMs Marketscope 2.0 charts)
The Fibonacci Sequence
Before applying Fibonacci to your chart, it helps to know a bit about the indicator. Fibonacci retracements are a tool used in conjunction with price action to find points of support and resistance on a price chart. Fibonacci does this by measuring the distance between a peak and a valley on your chart, and then extrapolating a percentage price rebounds (retraces) from these extreme points on the graph.
Retracement values that traders often look for include the 23.6%, 38.2%, 50%, 61.8% and 78.6% retracement of the designated move. Once the indicator is applied, v isually these points are represented on the graph by horizontal lines which may denote future support and resistance levels. Traditionally, traders begin to look for price s to move from these levels back into the direction of the initial trend. Thats why they tend to work so well in conjunction with a trendline!
Learn Forex GBPUSD Trend with Fibonacci
Trendline & Fibonacci
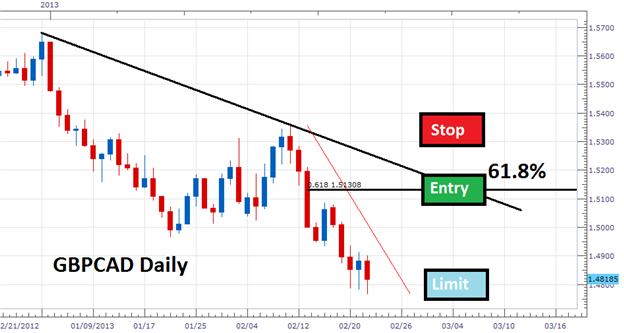
Now that you are familiarized with Fibonacci, one technique used to identify entries with the trend is to identify a confluence of either support in an uptrend or resistance in a downtrend. This is exactly how Fibonacci retracements and trendlines can be used together on a variety of charts and timeframes. The idea is to find an area where the two lines intersect, then use that value of support or resistance to plan an entry into the market.
Below we can again see our example with the GBPUSD. Our daily trendline is still on the chart, but this time a 50% retracement level has been included in the analysis. The retracement value will shows us when the market has moved half way between the previous high and current low, by measuring the distance between the two. Now we can find where this point intersects with our trendline, to identify a potential entry into the market.
Learn Forex GBPUSD Daily with Fibonacci & Trendline
(Created using FXCMs Marketscope 2.0 charts)
This is just one of many ways you can use Fibonacci in your trading. If you are just getting started trading or simply want to learn more about Fibonacci, sign up for our FREE Fibonacci trading course through Brainshark using the link below. Once you have registered through the Guestbook, you will find a series of videos designed to get you up to speed with Fibonacci. At the conclusion of the course, you can even check your knowledge with a variety of checkpoint questions.
—Written by Walker England, Trading Instructor
To contact Walker, email wengland@fxcm.com. Follow me on Twitter at @WEnglandFX.
To be added to Walkers e-mail distribution list, CLICK HERE and enter in your email information
Are you looking for other ways to interpret support and resistance levels? Take our free course on trading Fibonacci Retracements.
DailyFX provides forex news and technical analysis on the trends that influence the global currency markets.


